
Article Figures & Data
Figures
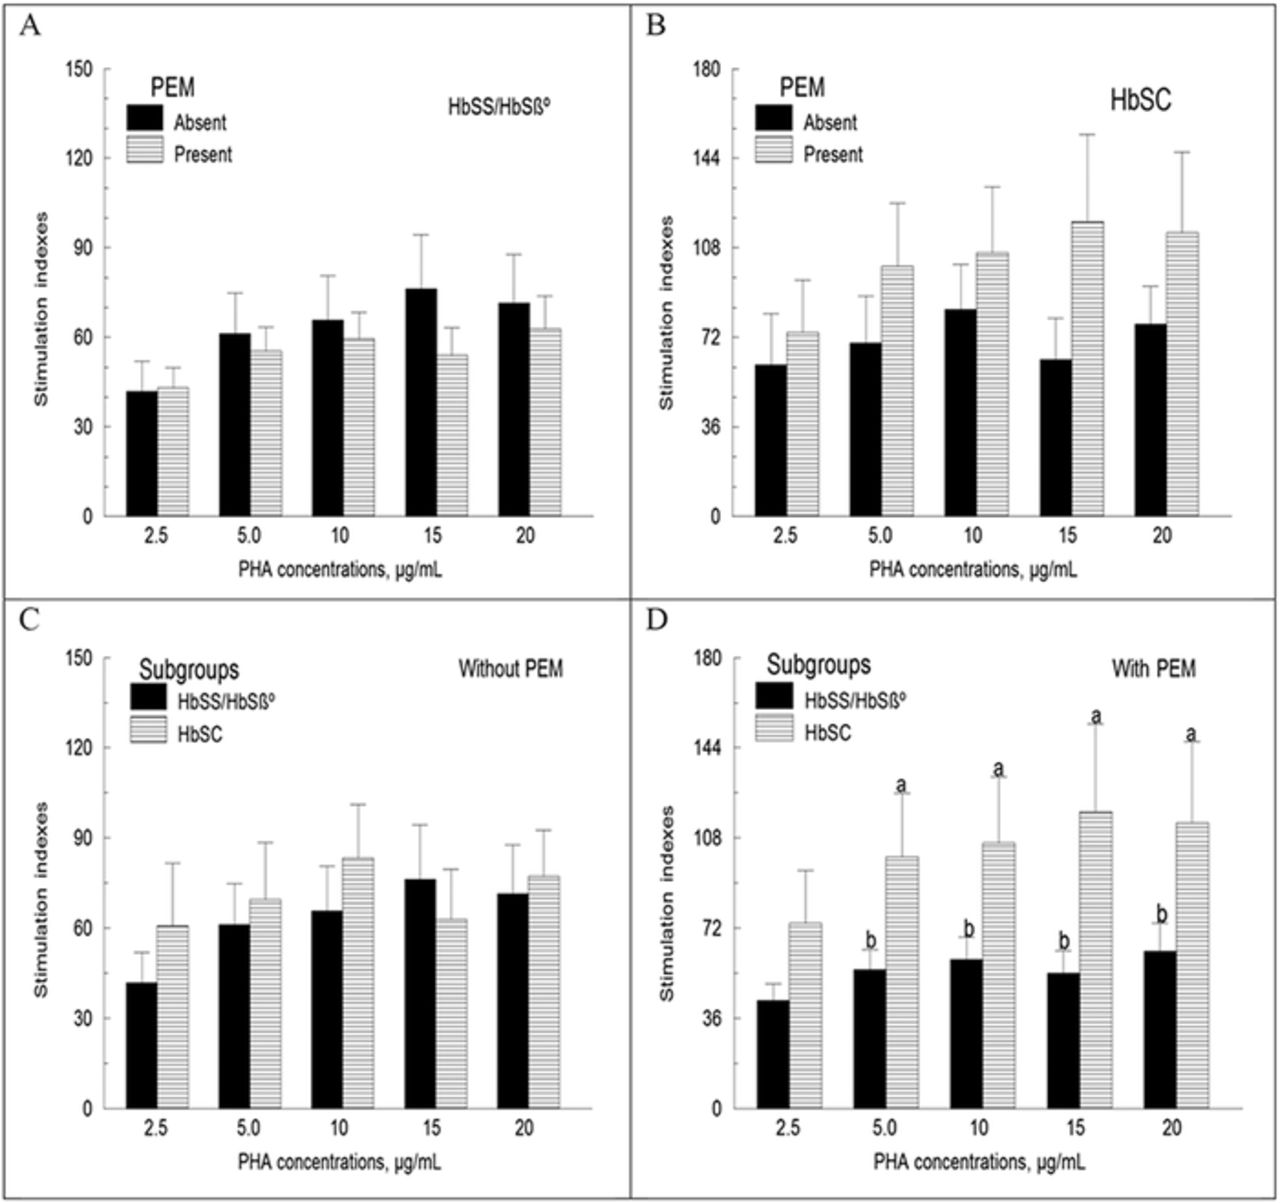
- Figure 1.
Lymphocyte proliferation as a function of mild to moderate protein-energy malnutrition (PEM) and hemoglobin (Hb) genotype expressed as stimulation indexes. Mononuclear cells were incubated with and without phytohemagglutinin (PHA) for 48 hours before being pulsed with 3H-thymidine for 24 hours. Results are expressed as stimulation indexes or the ratio of the amount of radioactivity incorporated into DNA by cells incubated with PHA over baseline. Sample sizes for PEM absent vs PEM present are as follows: HbSS/HbSβ°, 21 vs 34 and HbSC, 12 vs 15. Values are means ± standard error of the mean. In Figure 1D, the means of patients in the HbSC subgroup are higher than those of patients in the HbSS/HbSβ° subgroup (a>b; P<0.05).
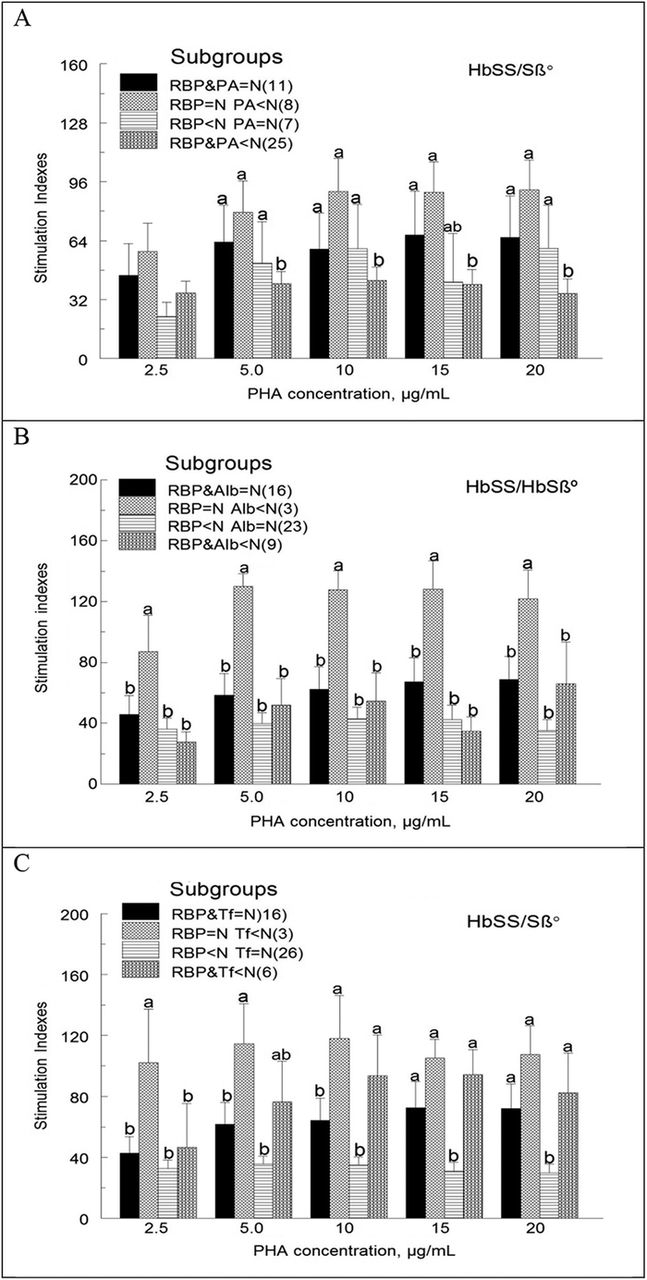
- Figure 2.
The effects of retinol binding protein (RBP) in combination with other transport proteins on lymphocyte proliferation in the subgroup of children with the HbSS or HbSβ° genotype. Mononuclear cells were incubated with and without phytohemagglutinin (PHA) before being pulsed with 3H-thymidine as explained in the legend for Figure 1. The 4 subgroups in view A are as follows: normal RBP and prealbumin (PA); normal RBP, below normal PA; below normal RBP, normal PA; below normal RBP and PA. In views B and C, PA is replaced by albumin (Alb) and transferrin (Tf), respectively. For each subgroup, numbers in parentheses are the sample sizes. Values are means ± standard error of the mean. For each PHA concentration, mean stimulation indexes (depicted as bars) among the 4 subgroups denoted with the letter a are higher than those denoted with the letter b (a>b; P<0.05).
- Figure 3.
Effect of inflammation on lymphocyte proliferation in children with the HbSS/HbSβ° genotypes and those with the HbSC genotype. Mononuclear cells were incubated with and without phytohemagglutinin (PHA) for 48 hours before being pulsed with 3H-thymidine for 24 hours. Results are expressed as stimulation indexes or the ratio of the amount of radioactivity incorporated into DNA by cells incubated with PHA over baseline. In views A and B, sample sizes are 31 vs 24 and 13 vs 8 for the HbSS/HbSβ° and HbSC subgroups, respectively. Values are means ± standard error of the mean. In the presence of inflammation, the mean stimulation indexes of children with the HbSC genotype were higher than those of children with the HbSS/HbSβ° genotypes (a>b; P<0.05).
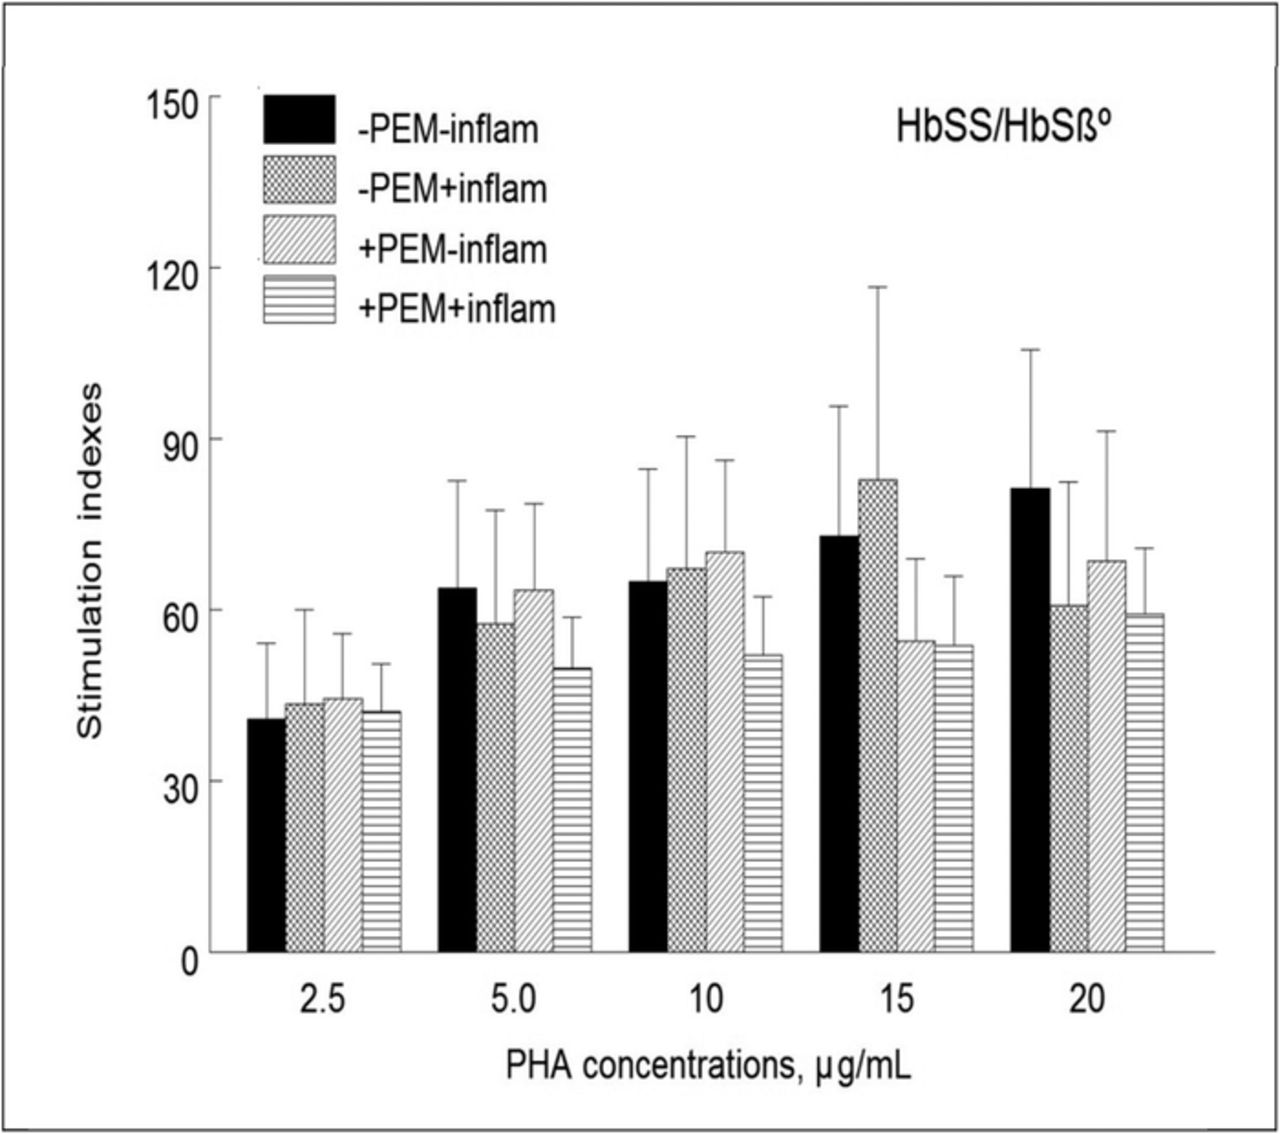
- Figure 4.
Lymphocyte proliferation in the subgroup of children with the HbSS/HbSβ° genotypes as a function of undernutrition (protein-energy malnutrition [PEM]) without and with inflammation (inflam). Mononuclear cells were incubated with and without phytohemagglutinin (PHA) before being pulsed with 3H-thymidine for 24 hours as explained in the legend for Figure 1. Results are expressed as stimulation indexes. The 4 subgroups are as follows: no PEM or inflammation (n=13); no PEM, inflammation (n=8); PEM, no inflammation (n=14); PEM and inflammation (n=20). Values are means ± standard error of the mean. For each PHA concentration, analysis of variance did not detect significant differences among the 4 subgroups of children.
- Figure 5.
Interleukin-2 (IL-2) activity in blood mononuclear cell cultures as a function of prealbumin (PA) concentration. Blood mononuclear cells were incubated with and without phytohemagglutinin (PHA) for 48 hours. The supernatants were collected and tested for IL-2 biological activity on IL-2–dependent (CTLL-2) cells. IL-2 was not measured in some of the cultures. Sample sizes are 9 vs 21 and 5 vs 6 in the HbSS/HbSβ° and HbSC subgroups, respectively. Values are means ± standard error of the mean. For each PHA concentration, mean IL-2 biological activity (depicted as bars) with unlike superscript letters are significantly different (a>b; P<0.05).


Tables
- Table 1.
Demographic Variables and Mean Indicators of Nutritional Status, Hematologic Measurements, and Acute Phase Proteins as a Function of Hemoglobin Genotype
HbSS/HbSβ° Genotypes HbSC Genotype Subgroup Subgroup Variable/Indicator n=63 n=27 Boys: Girls 34:29 16:11 Age, years 8.28 ± 0.53a 6.46 ± 0.86b Weight percentile 33.75 ± 3.70b 63.41 ± 6.87a Weight Z-score –0.52 ± 0.14b 0.45 ± 0.10a Height percentile 38.05 ± 4.17b 68.73 ± 6.75a Height Z-score –0.37 ± 0.15b 0.92 ± 0.24a White blood cells × 106/mL 12.38 ± 0.68a 9.49 ± 0.78b Hemoglobin, g/dL 8.27 ± 0.18b 11.11 ± 0.26a Hematocrit, % 26.22 ± 0.60b 32.39 ± 0.49a Albumin, g/L 41.54 ± 0.98 38.99 ± 1.45 Prealbumin, mg/L 133.73 ± 7.16b 160.72 ± 12.65a Transferrin, g/L 2.36 ± 0.07 2.52 ± 0.13 Retinol binding protein, mg/L 18.70 ± 0.95b 25.82 ± 1.93a α1-acid-glycoprotein, g/L 0.66 ± 0.03 0.73 ± 0.04 C-reactive protein, mg/L 5.87 ± 1.52 2.35 ± 1.01 Ceruloplasmin, mg/L 495.50 ± 18.35 478.00 ± 29.00 Notes: Data are presented as means ± standard error of the mean. For each measurement, means of both groups with different superscript letters are statistically different: a>b; P<0.05.
- Table 2.
Effect of Mild to Moderate Protein-Energy Malnutrition (PEM) on Interleukin-2 Activity in Phytohemagglutinin (PHA)-Treated Peripheral Blood Mononuclear Cells as a Function of Hemoglobin Genotype
Interleukin-2 Activity, IU/mL Group Without PEM With PEM Genotype PHA, μg/mL Mean ± SEM Median Mean ± SEM Median HbSS/HbSβ° subgroup 0 1.11 ± 0.34 0.96 1.59 ± 0.33 1.15 5 5.34 ± 1.09 5.33 5.41 ± 1.09 3.95 10 4.32 ± 1.07 2.77 5.11 ± 1.21 4.13 20 7.92 ± 5.49 2.66 6.19 ± 2.52 1.48 HbSC subgroup 0 1.44 ± 0.47 0.96 1.00 ± 0.50 0.43 5 6.21 ± 1.73 4.51 3.78 ± 2.66 2.11 10 5.09 ± 1.33 3.77 3.53 ± 2.06 2.04 20 7.57 ± 4.28 4.37 8.47 ± 5.85 8.48 Notes: Data are presented as means ± standard error of the mean. Sample sizes are 13 without PEM vs 20 with PEM and 8 without PEM vs 4 with PEM for the HbSS/HbSβ° and HbSC subgroups, respectively (interleukin-2 activity was not assayed in some of the samples). No significant differences were observed among children with and without PEM or between genotype subgroups.
- Table 3.
Effect of Inflammation on Interleukin-2 Activity in Phytohemagglutinin (PHA)-Treated Peripheral Blood Mononuclear Cells by Hemoglobin Genotype
Interleukin-2 Activity, IU/mL HbSS/HbSβ° Genotypes Subgroup HbSC Genotypes Subgroup Without With Without With Inflammation Inflammation Inflammation Inflammation PHA Concentration (n=19) (n=13) (n=8) (n=3) 0 1.37 ± 0.33 1.64 ± 0.45 1.39 ± 0.50 1.29 ± 0.58 5 5.99 ± 1.18 4.73 ± 1.13 6.37 ± 1.99 3.78 ± 2.66 10 5.23 ± 1.34 4.34 ± 0.90 4.76 ± 1.38 4.12 ± 2.79 20 8.82 ± 4.04 3.74 ± 2.10 6.82 ± 4.46 N/A Notes: Data are presented as means ± standard error of the mean. No significant difference was observed within and between groups of children with and without inflammation.
N/A, not available (interleukin-2 data were not available for some of the children).
- Table 4.
Correlation Coefficients (r) for Lymphocyte Proliferation (Stimulation Indexes) and Interleukin-2 Activity in Phytohemagglutinin (PHA)-Treated Peripheral Blood Mononuclear Cells and Markers of Nutritional and Hematologic Status in Children With Sickle Cell Disease
Stimulation Indexes by PHA Interleukin-2 (IL-2) Activity by Concentration (μg/mL), r PHA Concentration (μg/mL), r Marker 2.5 5 10 15 20 0 5 10 20 Weight percentile –0.123 –0.116 –0.046 –0.116 0.030 0.0187 0.215 0.254 0.174 Albumin –0.060 –0.127 –0.150 –0.137 –0.174 –0.348* –0.169 –0.319* –0.588* Prealbumin 0.077 0.035 0.038 –0.027 –0.037 0.383* 0.516* 0.456* 0.542* Transferrin –0.022 –0.118 –0.135 –0.132 –0.142 –0.146 –0.233 0.086 –0.145 Retinol binding protein 0.294* 0.372* 0.357* 0.454* 0.440* –0.184 –0.049 –0.075 0.264 Hemoglobin 0.294* 0.222* 0.246* 0.221 0.293* 0.022 –0.059 0.046 0.210 White blood cell count –0.160 –0.106 –0.141 –0.087 –0.124 –0.200 –0.268* –0.260* –0.095 Notes: Children with the HbSS, HbSβ°, and HbSC genotypes were included in the calculations of correlation coefficients. R values (coefficients) with asterisks are different from zero (P<0.05). Some P values [r] between weight and IL-2 and retinol binding protein and IL-2 that appear as if they should be significant are not significant because of sample size.
In this issue


Jump to section
Cited By...
- No citing articles found.