


Abstract
The incidence of migraine in a general population has been assessed in few longitudinal studies, and the incidence of tension-type headache has never been assessed. The authors aimed to assess the incidence of migraine and tension-type headache in Denmark by conducting a 12-year follow-up study of a general population (1989–2001). The design and methods of follow-up replicated the baseline study exactly, including use of the International Headache Society's diagnostic criteria and administration of headache diagnostic interviews by a physician. Of 740 persons aged 25–64 years examined in 1989, 673 were eligible in 2001 and 549 (81.6%) participated. The incidence of migraine was 8.1 per 1,000 person-years (male:female ratio, 1:6), and the incidence of frequent tension-type headache was 14.2 per 1,000 person-years (male:female ratio, 1:3). Both rates decreased with age. The incidence of migraine was higher than that previously calculated from cross-sectional studies. Risk factors for migraine were familial disposition, no vocational education, a high work load, and frequent tension-type headache. For tension-type headache, risk factors were poor self-rated health, inability to relax after work, and sleeping few hours per night. The gender difference for tension-type headache differed from that for migraine, and no association with educational level was observed.
Numerous cross-sectional studies have established that two types of primary headache, migraine and tension-type headache, are prevalent in the general population (1–4). In contrast to the abundance of prevalence studies, longitudinal studies estimating the incidence of primary headache disorders and identifying risk factors in the general population are sparse (5–7). A follow-up study of an adult cohort aged 21–30 years from the general population assessed the bidirectional influences between major depression and migraine after 3.5 years and 5.5 years (5). The study found the incidence of migraine per 1,000 person-years to be 5.0 for males and 22.0 for females (5). Another study did not assess migraine status at baseline but used a nonspecific screening question to establish the at-risk population (6). However, this study found equally as high incidence rates as did Breslau et al. (5).
In light of the very few longitudinal studies of this topic, previous studies have estimated the incidence of migraine from recalled age at onset in cross-sectional studies, although age at onset might be subject to recall bias (8, 9). The resulting incidence rates are lower than the rates in the longitudinal studies. No study of the incidence of tension-type headache has been retrieved. The potential risk factors for developing migraine and tension-type headache have generally been determined in cross-sectional studies, despite the major methodological limitations of this approach (8, 10). In prevalence studies, migraine is (among other factors) associated with White race, low educational attainment, familial disposition, and mental disorders (10).
In 1989, we conducted a population-based prevalence study of the primary headache disorders migraine and tension-type headache in Denmark (11). In 2001, we conducted the current population-based study of primary headache, which included follow-up of the cohort from 1989. In the present analysis, our aims were to assess the incidence of migraine and tension-type headache and to identify risk factors for developing these primary headaches.
MATERIALS AND METHODS
The 1989 headache study
In the 1989 study of migraine and tension-type headache (11), 1,000 residents aged 25–64 years were randomly chosen from the Danish Civil Registration System in 11 suburban communities in the County of Copenhagen, Denmark. This sampling method ensured the selection of a random sample of the general population, since all residents of Denmark are registered in the Civil Registration System with a unique 10-digit code. The subjects were invited to participate in an extensive investigation conducted by two physicians (B. K. R., R. J.), including a clinical interview with emphasis on primary headaches and a physical and neurologic examination. Each distinct form of headache was diagnosed according to the International Headache Society's 1988 classification and diagnostic criteria for headache disorders (12). Of 975 eligible subjects, 740 (76 percent) participated. The age and gender distribution of the participants was representative of the cohort and the background population (11). The methods and results of this study are described thoroughly elsewhere (8, 11, 13).
The 2001 headache study
In 2001, a follow-up study of the 1989 cohort was implemented, including all subjects who in 2001 were alive, living in Denmark, and able to answer written and verbal questions. The cohort was not subject to investigation or intervention between the surveys. All eligible subjects, now aged 37–76 years, were identified through the Danish Civil Registration System and invited by mail to participate in an extensive investigation with an emphasis on primary headaches, including a clinical headache interview and a physical and neurologic examination. If there was no response to the mailed invitation, subjects were contacted and asked to complete a headache interview by telephone. All interviews and examinations throughout the 2001 survey, including the telephone interviews, were conducted between May 2001 and April 2002 by a single physician (A. L.). The investigator was trained in headache diagnostics at the Danish Headache Centre and supervised by the baseline investigators (R. J., B. K. R.).
Headache diagnostics
We used exactly the same procedures, questions, and wordings in 2001 as in 1989 in endeavoring to replicate the baseline survey. The headache interviews were semistructured, since the questions, phrasing, and sequence were standardized in advance, but the interviewer was allowed to reword the questions if necessary to improve communication. The headache interviews included an extensive description of each type of headache, and all subjects were questioned specifically about aura symptoms, headache with migraine features, and tension-type headache. The interviewer had no knowledge of the headache diagnoses from 1989. As in 1989, information about sociodemographic and psychological factors and lifestyle was obtained through self-administered questionnaires. Questions were phrased as in 1989 and are described thoroughly elsewhere (8, 11, 13).
The telephone interview was conducted with the same semistructured technique, interview questions, sequence, diagnostic criteria, and interviewer as the face-to-face interview. All interview questions necessary for diagnosing primary headaches were included, but we omitted questions on less important issues (such as secondary headache types and some sociodemographic and lifestyle factors) from the telephone interview in order to limit time expenditure. The main difference in primary headache diagnostics between the telephone interviews and the face-to-face interviews was the absence of physical and neurologic examinations.
As in 1989, each distinct form of headache was extensively described and diagnosed on the basis of the International Headache Society's 1988 classification and diagnostic criteria for headache disorders (12). The classification is hierarchically constructed and provides an algorithm for use in clinical settings. The numeric code of each diagnosis was recorded to the one-digit level. In this paper, the term “frequent tension-type headache” designates frequent episodic and chronic tension-type headache (15 or more headache days per year). “Chronic tension-type headache” was defined as 180 or more headache days per year (14).
Organization and ethics
The study was carried out at the Research Centre for Prevention and Health at Glostrup University Hospital and was approved by the Ethical Committee for Copenhagen County and the Danish Data Protection Agency. Informed consent was obtained from each participant before the interview.
Data analyses and statistics
The population at risk of migraine comprised all subjects who in 1989 had never experienced migraine. The population at risk of frequent tension-type headache included all subjects without frequent tension-type headache in 1989. To minimize diagnostic impurity, we excluded subjects with migraine attacks in 1989 from the at-risk population for incident tension-type headache. We estimated the cumulative incidence rate over the 12-year period using the total number of incident cases in the at-risk population. We calculated annual incidence rates by means of the following equation: annual incidence = 1 − (1 − cumulative incidence)1/12 (15). We applied the same procedure when calculating the 95 percent confidence intervals.
The risk factors for incident headache were independent variables that were assessed in 1989 and selected a priori on the basis of significance in several cross-sectional studies or in the baseline study (1, 8, 10, 16, 17). Variables on age, gender, educational level, familial disposition, working conditions, psychosocial factors, and sleep pattern were included in the model. We analyzed age as decennial age in order to assess the risk associated with a 10-year increase in age. We tested for a possible nonlinear association between age and poor outcome by including age squared in the analyses, but this variable was not significant.
Variables with more than two categories were reduced to binary variables because of the limited number of cases in the analyses. Educational level was dichotomized as any vocational education (vocational training, college degree, or university degree) versus no vocational education (obligatory primary schooling including high school as the highest educational level). Subjects reporting the presence of migraine or tension-type headache in their immediate family (parents, siblings, or children) were defined as having a familial disposition for migraine or tension-type headache. Self-rated health was measured as a four-level variable, and responses were collapsed into a dichotomous variable representing good (very good or good) versus poor (poor or fair) self-rated health.
Univariate logistic regression analyses were performed, and multivariate logistic regression models for each category of risk factors (psychosocial factors, headache disposition, working conditions, and physical factors) were constructed by including age, gender, and relevant risk factors with p values less than 0.20. Odds ratios and 95 percent confidence intervals were calculated. For the multivariate models, Hosmer and Lemeshow's goodness-of-fit test was used to control the fit of the model. All data analyses were carried out using the SAS statistical package, version 8e (SAS Institute, Inc., Cary, North Carolina).
RESULTS
Participation
In 2001, 673 of the 740 participants in the 1989 study were eligible. The 67 noneligible subjects were distributed as follows: 42 were deceased, nine had emigrated, six were missing, and 10 were unable to answer questions in Danish or English (because of a language barrier (n = 6), dysphasia after stroke (n = 1), dementia (n = 2), or pronounced mental retardation (n = 1)). In total, 549 (81.6 percent) of the 673 eligible subjects participated; 403 (73 percent) were interviewed face-to-face and 146 (27 percent) were interviewed by telephone. When assessed by logistic regression, the participants were representative of the eligible study population with regard to gender and, for subjects younger than age 65 years in 2001, with regard to age. Subjects aged 65 years or older were less likely to participate (p = 0.008). The participants in the 2001 survey did not differ significantly from nonparticipants and noneligible persons with regard to headache status in 1989 (figure 1). No difference in gender, migraine status, or tension-type headache status in 1989 emerged when data from the face-to-face interview were compared with those from the telephone interview (logistic regression analysis: for gender, p = 0.89; for migraine, p = 0.16; for tension-type headache, p = 0.76). Young age was associated with participation in the telephone interview (p = 0.01).
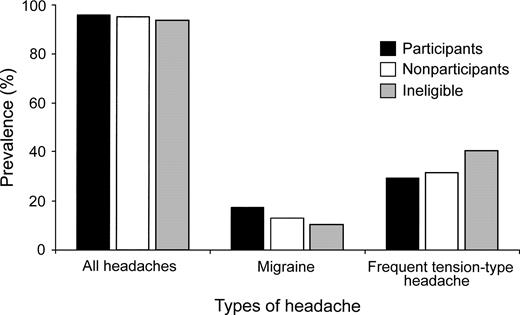
Prevalence of headache in 1989 according to participation status in 2001 in a Danish population-based follow-up study. All headaches: χ2 = 0.84 (2 df), p = 0.66; migraine: χ2 = 3.3 (2 df), p = 0.19; tension-type headache: χ2 = 3.4 (2 df), p = 0.18.
Migraine incidence
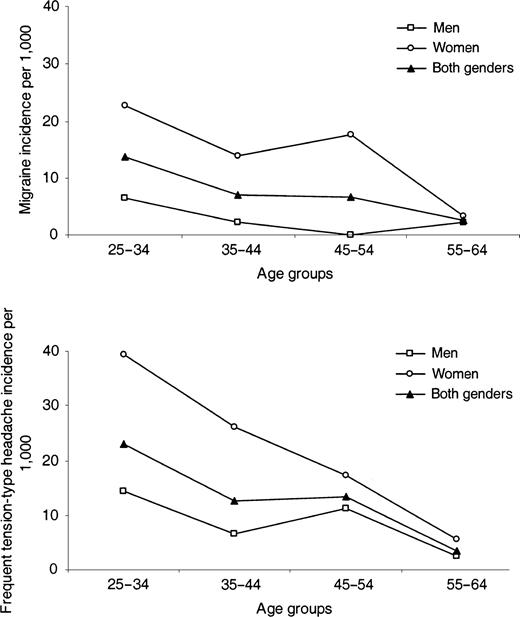
There were 42 incident cases of migraine in the population at risk (n = 453), corresponding to an annual incidence of migraine (with and without aura) of 8.1 per 1,000 (table 1). The male:female ratio was 1:6.2. In both genders, the incidence decreased markedly with age (p = 0.004) (figure 2). Table 2 shows results from the univariate analyses of the risk factors with adjustment for age and gender. Significant risk factors in the multivariate models were young age, female gender, no vocational education, familial disposition, a high work load, and frequent tension-type headache (table 3). Of the 42 subjects with incident migraine, 25 had only migraine without aura. Seven subjects had both migraine with aura and migraine without aura, and 10 subjects had only migraine with aura. No significant age or gender difference was found for incident migraine with aura or migraine without aura (for gender, p = 0.89; for age, p = 0.29). Because of small numbers, differences in risk factors were not assessed.
Annual incidence rates for migraine and frequent tension-type headache in a Danish general population, 1989–2001.
Annual incidence rates for migraine and frequent tension-type headache in a Danish general population, 1989–2001
Age (years) in 1989 | Migraine | Frequent tension-type headache | ||||||||
|---|---|---|---|---|---|---|---|---|---|---|
| Rate per 1,000 | 95% CI* | No. of cases | Rate per 1,000 | 95% CI | No. of cases | |||||
| 25–34 | 13.8 | 7.8, 20.1 | 19 | 23.1 | 14.0, 33.2 | 22 | ||||
| 35–44 | 7.0 | 3.0, 11.2 | 11 | 12.8 | 6.4, 19.7 | 14 | ||||
| 45–54 | 6.7 | 2.7, 10.9 | 10 | 13.5 | 6.9, 20.5 | 15 | ||||
| 55–64 | 2.6 | 0.3, 6.4 | 2 | 3.5 | 0.4, 12.5 | 2 | ||||
| Total | 8.1 | 5.7, 10.5 | 42 | 14.2 | 10.4, 18.0 | 53 | ||||
CI, confidence interval.
Univariate odds ratios (adjusted for age and gender) for incidence of migraine and frequent tension-type headache between 1989 and 2001 in relation to factors reported in 1989 in a Danish population-based follow-up study, 2001
Variable | % with risk factor | Migraine (n = 453) | Tension-type headache (n = 337) | ||||
|---|---|---|---|---|---|---|---|
| OR† | 95% CI† | OR | 95% CI | ||||
| Gender (female vs. male) | 42.6 | 6.6* | 3.0, 14.8 | 2.9* | 1.6, 5.4 | ||
| Mean age (per decennial increase) | 42.7 | 0.6* | 0.4, 0.8 | 0.6* | 0.4, 0.8 | ||
| Familial disposition (yes vs. no) | 32.9 | 3.1* | 1.6, 6.2 | 1.7 | 0.9, 3.3 | ||
| Vocational education (none vs. any) | 26.9 | 2.9* | 1.5, 5.7 | 1.1 | 0.6, 2.2 | ||
| Marital status (single vs. married) | 17.0 | 1.2 | 0.5, 2.8 | 1.3 | 0.6, 2.9 | ||
| Employment (not working vs. working) | 12.8 | 0.6 | 0.2, 1.8 | 1.7 | 0.8, 3.8 | ||
| Self-rated health (bad vs. good) | 15.9 | 1.8 | 0.8, 3.8 | 3.7* | 1.7, 8.3 | ||
| Problems at home or at work (yes vs. no) | 43.3 | 0.7 | 0.4, 1.4 | 1.3 | 0.7, 2.5 | ||
| Having a close friend (no vs. yes) | 39.3 | 1.9 | 0.9, 3.9 | 1.4 | 0.8, 2.8 | ||
| Regular physical exercise (no vs. yes) | 62.5 | 1.1 | 0.5, 2.3 | 1.4 | 0.7, 2.8 | ||
| Snoring (yes vs. no) | 39.7 | 2.0 | 0.9, 4.2 | 1.4 | 0.7, 2.7 | ||
| Feelings of fatigue (yes vs. no) | 38.6 | 0.9 | 0.5, 1.9 | 2.5* | 1.3, 4.6 | ||
| Sleeping problems (yes vs. no) | 21.0 | 1.3 | 0.6, 2.8 | 2.7* | 1.3, 5.6 | ||
| Feeling refreshed when awakening (no vs. yes) | 49.7 | 1.1 | 0.5, 2.1 | 2.0* | 1.1, 3.7 | ||
| Mean hours of sleep per night (per 1-hour decrease) | 7.0 | 1.1 | 0.8, 1.6 | 1.4* | 1.1, 2.0 | ||
| Having a high work load (yes vs. no) | 34.9 | 2.2* | 1.1, 4.3 | 0.7 | 0.4, 1.4 | ||
| Having too little time to do work (yes vs. no) | 20.5 | 0.9 | 0.4, 2.1 | 1.4 | 0.6, 3.2 | ||
| Being able to relax after work (no vs. yes) | 9.3 | 0.6 | 0.2, 1.9 | 3.1* | 1.1, 8.7 | ||
| Exposure to noise at work (yes vs. no) | 22.9 | 1.8 | 0.9, 3.9 | 1.4 | 0.7, 2.9 | ||
| Exposure to vapors at work (yes vs. no) | 16.3 | 1.6 | 0.6, 4.0 | 1.4 | 0.6, 3.3 | ||
| Use of oral contraceptives (yes vs. no) | 10.9 | 1.5 | 0.5, 4.5 | 0.5 | 0.1, 1.7 | ||
| Frequent tension-type headache (yes vs. no) | 25.6 | 2.5* | 1.3, 5.0 | —‡ | — | ||
p ≤ 0.05.
OR, odds ratio; CI, confidence interval.
Subjects with migraine were not included in the at-risk group for tension-type headache.
Multivariate odds ratios for incidence of migraine between 1989 and 2001 in relation to factors reported in 1989 in a Danish population-based follow-up study, 2001†
Model and variables | Odds ratio‡ | 95% confidence interval |
|---|---|---|
| Model 1: psychosocial factors | ||
| Gender (female vs. male) | 7.6* | 3.2, 17.8 |
| Age (per decennial increase) | 0.6* | 0.4, 0.8 |
| Vocational education (none vs. any) | 2.8* | 1.4, 5.6 |
| Having a close friend (no vs. yes) | 1.8 | 0.9, 3.9 |
| Model 2: headache disposition | ||
| Gender (female vs. male) | 4.8* | 2.1, 11.0 |
| Age (per decennial increase) | 0.6* | 0.4, 0.9 |
| Familial disposition (yes vs. no) | 2.9* | 1.4, 5.8 |
| Frequent tension-type headache (yes vs. no) | 2.1* | 1.1, 4.3 |
| Model 3: working conditions | ||
| Gender (female vs. male) | 6.7* | 2.9, 14.9 |
| Age (per decennial increase) | 0.6* | 0.4, 0.9 |
| High work load (yes vs. no) | 2.1* | 1.0, 4.1 |
| Noise at work (yes vs. no) | 1.6 | 0.8, 3.4 |
| Model 4: physical factors | ||
| Gender (female vs. male) | 7.6* | 3.3, 17.7 |
| Age (per decennial increase) | 0.6* | 0.4, 0.8 |
| Self-rated health (bad vs. good) | 1.7 | 0.8, 3.7 |
| Snoring (yes vs. no) | 1.9 | 0.9, 4.0 |
p ≤ 0.05.
In total, there were 42 incident cases of migraine among 453 subjects at risk.
Multivariate logistic regression models for risk factors with univariate p values less than 0.20.
Tension-type headache incidence
The annual incidence of frequent tension-type headache was 14.2 per 1,000 (table 1), since there were 53 incident cases in the population at risk (n = 337). The male:female ratio was 1:2.6. The incidence of tension-type headache also decreased markedly with age (p = 0.001) (figure 2). Table 2 shows results from the univariate analyses of possible risk factors with adjustment for age and gender. In the multivariate models, young age, female gender, poor self-rated health, not being able to relax after work, and sleeping few hours per night were significant risk factors for incident tension-type headache (table 4).
Multivariate odds ratios for incidence of frequent tension-type headache between 1989 and 2001 in relation to factors reported in 1989 in a Danish population-based follow-up study, 2001†
Model and variables | Odds ratio‡ | 95% confidence interval |
|---|---|---|
| Model 1: psychosocial factors | ||
| Gender (female vs. male) | 2.9* | 1.6, 5.3 |
| Age (per decennial increase) | 0.6* | 0.4, 0.8 |
| Employment (not working vs. working) | 1.7 | 0.8, 3.8 |
| Model 2: headache disposition | ||
| Gender (female vs. male) | 2.5* | 1.3, 4.7 |
| Age (per decennial increase) | 0.6* | 0.4, 0.8 |
| Familial disposition (yes vs. no) | 1.7 | 0.9, 3.3 |
| Model 3: working conditions | ||
| Gender (female vs. male) | 2.9* | 1.5, 5.7 |
| Age (per decennial increase) | 0.6* | 0.5, 0.9 |
| Being able to relax after work (no vs. yes) | 3.1* | 1.1, 8.9 |
| Model 4: physical factors | ||
| Gender (female vs. male) | 3.0* | 1.6, 5.8 |
| Age (per decennial increase) | 0.6* | 0.4, 0.8 |
| Self-rated health (bad vs. good) | 3.0* | 1.2, 7.2 |
| Feelings of fatigue (yes vs. no) | 1.7 | 0.8, 3.6 |
| Sleeping problems (yes vs. no) | 1.7 | 0.8, 3.7 |
| Feeling refreshed when awakening (no vs. yes) | 1.2 | 0.6, 2.4 |
| Mean hours of sleep per night (per 1-hour decrease) | 1.4* | 1.1, 2.0 |
p ≤ 0.05.
In total, there were 53 incident cases of tension-type headache among 337 subjects at risk.
Multivariate logistic regression models for risk factors with univariate p values less than 0.20.
DISCUSSION
Methodological considerations
This longitudinal study of primary headaches complements the very few prior studies of migraine incidence. Major strengths of the study were the representative sampling of a general population in 1989, the complete follow-up, the exact replication of the original study design and methods, and the detailed medical headache interviews conducted in both 1989 and 2001. All headache diagnoses were made by experienced physicians in interviews; moreover, all headache diagnoses in 2001 were made by the same physician (A. L.), who had been trained by the baseline investigators and blinded to the baseline data, thus minimizing any diagnostic variation.
To ensure a high participation rate, we contacted by telephone all subjects who did not respond to the mailed invitation. The telephone interviews were conducted as meticulously as the face-to-face interviews, and only some secondary issues not affecting the diagnosis of primary headaches were omitted. The difference in headache assessment was mainly the absence of a physical examination. We have previously shown that physical and neurologic examinations rarely affect headache diagnoses in the general population because of the relatively few symptomatic headaches in this setting (18). The validity and reliability of diagnostic questionnaires and diagnostic telephone interviews have been assessed by comparison with clinical interviews as the “gold standard” (19). The diagnostic telephone interviews were found to have very good agreement with the clinical interviews. This is in concordance with our previous experience in another Danish epidemiologic study (20); thus, no differential ascertainment by the two modes is expected.
The study area was suburban and representative of the total Danish population as regards age, gender, and marital status, and the cohort has been shown to be representative of the background population (8, 11). The response rates in 1989 and in 2001 were comparable and acceptably high, and no association between participation rate in 2001 and headache status in 1989 was seen. Thus, a substantial nonresponse bias, which may skew the data and result in overestimation of incidence rates, is not expected. The initial cohort of 1,000 adults was restricted to adults aged 25–64 years. The limited age span did not allow us to estimate incidence rates in younger age groups. Likewise, the modest size of the cohort led to a rather low number of cases, which entailed uncertainty in the estimates of incidence rates and the risk factor associations and also limits the possibility of providing subgroup analyses. In the present study, no assessment of headache status was conducted between baseline and follow-up; hence, the precise timing of headache onset was not known.
Annual incidence rates were calculated from cumulative incidence rates, since age at onset is subject to marked recall bias (21). To minimize diagnostic impurity, subjects with migraine in 1989 were excluded from the group at risk of tension-type headache. This approach reduces the risk of misclassification error while increasing the risk of underestimating the incidence rates. Incidence rates for tension-type headache calculated without excluding subjects with migraine were slightly higher but not markedly different from the incidence rates presented (15.9 per 1,000 instead of 14.2 per 1,000). Thus, any underestimation of the incidence rates is believed to have been minor.
Migraine incidence
In this 12-year follow-up study, we found migraine incidence rates to decrease markedly with increasing age. In concordance with two prior longitudinal studies, the highest rates were found in the age group 25–34 years, with annual incidence rates of 6.5 per 1,000 for males and 22.8 per 1,000 for females (5, 6). The prior studies reported on the incidence of migraine, and they were additionally designed to assess the association between mental disorders and migraine (5–7). In a 3.5-year follow-up period, Breslau et al. (5) found annual migraine incidence in young adults to be 5.0 per 1,000 for males and 22.0 per 1,000 for females. The 5.5-year follow-up of the same cohort yielded the same figures (7), which is consistent with the present findings. In the other study, the at-risk group was defined by a negative answer to the nonspecific screening question “Have you ever had a lot of trouble with headaches?” in the primary investigation (6). In the young age group, the incidence rate was comparable to that seen in the study by Breslau et al. (5). For the age group above 45 years, the incidence rate was 3.3 per 1,000, which is on the same level as our incidence rates for subjects aged 45–64 years (6). Thus, our incidence rates and age distributions agree with those of these longitudinal studies.
Surprisingly, our female:male ratio was 6.2, thus being higher than the prior male:female ratios of incidence of 4.4 and 3.4. The gender ratios for prevalent migraine vary between 2.5 and 3.8 (1), a range which is lower than the gender ratio in the previous longitudinal studies. Our high gender difference may partly be an effect of imprecision related to the modest size of our cohort. Concurrently, a higher female:male ratio in adult incidence data as compared with prevalence data supports previous observations of a later onset of migraine in women than in men (5, 9, 22, 23).
Otherwise, incidence rates for migraine have been calculated from age at onset in cross-sectional studies. Stewart et al. (9) estimated the incidence of migraine for subjects under age 30 years to be 2.2 per 1,000 person-years in males and 6.0 per 1,000 person-years in females. New cases of migraine were relatively uncommon among adult males but were common among adult females; for the age group 28–29 years, the incidence of migraine with or without aura was 14.2 among females and 1.6 among males (9). In agreement, our 1989 study found the incidence per 1,000 person-years to be 1.8 for males under age 30 years and 6.5 for females under 30 (8). These calculated incidence rates are lower than those estimated from the longitudinal studies; this may be due to the shortcomings of retrospective estimates, especially as regards recall bias and ignoring possible changes in risk over time.
The incidence of medically recognized migraine, as assessed by the rate of new clinical cases of migraine registered in a health care registry, has been found to be 2.5 per 1,000 for males and 10.2 for females in the age group 25–29 years (24–26). These estimates are lower than those obtained from the longitudinal studies, but underestimation and referral bias were expected, since the consultation rate of migraineurs greatly influences these estimates.
Of our incident migraine cases, 40 percent described migraine aura, which is in line with prevalence studies finding that 30–40 percent of migraineurs report migraine aura (27, 28). Only a few studies have described the frequency of coexisting migraine with aura and migraine without aura. In the present study, 16 percent of participants reported migraine attacks of both types. In the 1989 prevalence study, 8 percent of migraineurs reported coexisting migraine with aura and migraine without aura. In a 40-year follow-up of subjects with migraine, Bille (21) found that aura accompanying migraine is very frequently subject to recall bias; hence, the frequency of coexisting migraine with aura and migraine without aura may be subject to recall bias.
Risk factors for incident migraine
Cross-sectional studies have suggested an association between prevalent migraine and a low educational level (10, 22, 27). This relation has been hypothesized to be mediated through poor living conditions, stress, or lack of access to health care (10). A 1996 Norwegian follow-up study that had assessed educational level 11 years before headache assessment found a low educational level at baseline to be associated with a higher risk of frequent migraine or nonmigraine headache (29). Subjects at risk were defined as those not using pain relievers in 1985, since no assessment of headache status was made at baseline. The low educational level in our study definitely preceded migraine incidence; thus, frequent migraine attacks did not reduce the subjects' ability to obtain vocational education (30). However, our results cannot shed light on the question of whether migraineurs' lower educational attainment could be a consequence of a migraine disposition's influencing the ability to obtain vocational education even before the onset of migraine attacks. In Denmark, health care is free of charge; thus, low socioeconomic status does not influence the ability to pay for health care, thereby reducing but not removing the influence of socioeconomic status on access to health care. A high workload and frequent tension-type headache were also significantly related to migraine incidence in our study. If the associations are valid, these factors could be hypothesized to be surrogate markers for chronic stressors, which may be part of a possible causal pathway for the association between migraine and low socioeconomic status (10). Future investigations are necessary to answer these questions. A higher risk of migraine among persons who have a first-degree relative with migraine is well-established in existing cross-sectional literature (10) and is also supported by our data.
Tension-type headache incidence
To our knowledge, the incidence of tension-type headache and the assessment of risk factors have never been reported in any prospective study (3). In cross-sectional studies, the prevalence, attack frequency, duration, and impact of tension-type headache vary considerably, with prevalence estimates ranging between 9 percent and 78 percent (2–4). Differential inclusion of subjects with rare episodes may be part of this variation, since the prevalence of frequent episodic or chronic tension-type headache varies considerably less (8). Generally, frequent episodic or chronic tension-type headache is identified in 20–30 percent of the general population (3, 4, 8, 31–33). Thus, the subdivision between infrequent episodic tension-type headache and frequent episodic tension-type headache introduced in the second edition of the International Headache Society's criteria (14) facilitates comparison of prevalence estimates by generating descriptions of both overall and subgroup prevalence of tension-type headache. In our 1989 study, the prevalence of frequent episodic or chronic tension-type headache was 31 percent overall and decreased with age (8, 11). The female:male gender ratio for frequent tension-type headache (2.2) was higher than the gender ratio for all tension-type headache (1.4). In accordance, the present female:male gender ratio was 2.9, and the incidence of tension-type headache decreased with increasing age. Cross-sectional studies have observed that the gender difference for tension-type headache is not quite as profound as that for migraine (3).
Risk factors for incident tension-type headache
In 1993, Schwartz et al. (4) found an association between increased educational level and increased prevalence of episodic tension-type headache, while the prevalence of chronic tension-type headache was oppositely associated with low educational level. No associations with educational level were found in our 1989 study (8) or in our present analyses of tension-type headache incidence, but analyses of subgroups were not feasible because of the modest number of cases. The association found here between incident frequent tension-type headache and poor self-rated health, not being able to relax after work, and sleeping fewer hours per night is interesting. In the 1989 study, prevalent tension-type headache was (among other factors) associated with feelings of fatigue and, among women, with a lack of ability to relax after work (8, 17). Associations between sleep insufficiency and frequent pain, poor self-rated health, and physical and mental distress are reported in cross-sectional studies (34). Even though the relation between sleep and headache disorders, including tension-type headache, has been previously reported (35), to our knowledge no longitudinal study on the sequencing of sleep and headache has ever been published. Our finding of sleep disturbances before the onset of tension-type headache is interesting; however, further investigations are required to evaluate the validity of these associations. If they are found to be valid, a new approach for preventing or treating tension-type headache might emerge.
Conclusion
This study was a longitudinal population-based study of the incidence of and risk factors for primary headache disorders. The incidence of primary headaches and their associations with risk factors were assessed in a 12-year follow-up study of a random sample of the general population. Exact replication of methods, high participation rates, and the administration of clinical interviews in both 1989 and 2001 ensured a high level of validity and stability. The incidence of migraine was 8.1 per 1,000, which is in agreement with previous longitudinal studies but higher than the incidence calculated from cross-sectional studies. Young age, female gender, no vocational education, familial disposition, a high work load, and frequent tension-type headache at baseline were found to increase the risk of migraine. The incidence of frequent tension-type headache was 14.2 per 1,000. The gender difference in tension-type headache differed from that in migraine, and no association with educational level was observed. We found associations between incident frequent tension-type headache and poor self-rated health, inability to relax after work, and sleeping fewer hours per night. Further investigations are required to evaluate these associations. Additional knowledge about risk factors for migraine and tension-type headache may reveal new approaches for prevention and treatment.
This study was supported by grants from the East Denmark Health Science Research Forum, the Danish Medical Association Research Fund, the Danish Health Insurance Foundation, the Danish Hospital Foundation for Medical Research, the Danish Headache Society, the Cool Sorption Foundation, GlaxoSmithKline A/S, Merck Sharp & Dohme A/S, Pfizer A/S, Lundbeck Pharma A/S, and H. Lundbeck A/S. The funding sources were not involved in the conduct of the study.
The authors thank the staffs of the Research Centre for Prevention and Health and the Department of Neurology, Glostrup University Hospital (Glostrup, Denmark), for their assistance.
The authors have no conflict of interest to declare.
References
Stewart WF, Shechter A, Rasmussen BK. Migraine prevalence: a review of population-based studies.
Jensen R. Diagnosis, epidemiology, and impact of tension-type headache.
Schwartz BS, Stewart WF, Simon D, et al. Epidemiology of tension-type headache.
Breslau N, Davis GC, Schultz LR, et al. Joint 1994 Wolff Award Presentation. Migraine and major depression: a longitudinal study.
Swartz KL, Pratt LA, Armenian HK, et al. Mental disorders and the incidence of migraine headaches in a community sample: results from the Baltimore Epidemiologic Catchment Area follow-up study.
Breslau N, Chilcoat HD, Andreski P. Further evidence on the link between migraine and neuroticism.
Stewart WF, Linet MS, Celentano DD, et al. Age- and sex-specific incidence rates of migraine with and without visual aura.
Breslau N, Rasmussen BK. The impact of migraine: epidemiology, risk factors, and co-morbidities.
Rasmussen BK, Jensen R, Schroll M, et al. Epidemiology of headache in a general population—a prevalence study.
Headache Classification Committee of the International Headache Society. Classification and diagnostic criteria for headache disorders, cranial neuralgias and facial pain.
Jensen R. Pathophysiological mechanisms of tension-type headache: a review of epidemiological and experimental studies.
Headache Classification Subcommittee of the International Headache Society. The international classification of headache disorders, 2nd edition.
Clayton D, Hills M. Statistical models in epidemiology. New York, NY: Oxford University Press,
Rasmussen BK. Migraine and tension-type headache in a general population: psychosocial factors.
Rasmussen BK. Migraine and tension-type headache in a general population: precipitating factors, female hormones, sleep pattern and relation to lifestyle.
Rasmussen BK, Olesen J. Symptomatic and nonsymptomatic headaches in a general population.
Hagen K, Zwart JA, Vatten L, et al. Head-HUNT: validity and reliability of a headache questionnaire in a large population-based study in Norway.
Russell MB, Rasmussen BK, Thorvaldsen P, et al. Prevalence and sex-ratio of the subtypes of migraine.
Stewart WF, Lipton RB, Celentano DD, et al. Prevalence of migraine headache in the United States: relation to age, income, race, and other sociodemographic factors.
Ulrich V, Gervil M, Fenger K, et al. The prevalence and characteristics of migraine in twins from the general population.
Stang PE, Yanagihara PA, Swanson JW, et al. Incidence of migraine headache: a population-based study in Olmsted County, Minnesota.
Rozen TD, Swanson JW, Stang PE, et al. Incidence of medically recognized migraine: a 1989–1990 study in Olmsted County, Minnesota.
Rozen TD, Swanson JW, Stang PE, et al. Increasing incidence of medically recognized migraine headache in a United States population.
Lipton RB, Stewart WF, Diamond S, et al. Prevalence and burden of migraine in the United States: data from the American Migraine Study II.
Rasmussen BK, Olesen J. Migraine with aura and migraine without aura: an epidemiological study.
Hagen K, Vatten L, Stovner LJ, et al. Low socio-economic status is associated with increased risk of frequent headache: a prospective study of 22718 adults in Norway.
Lipton RB, Stewart WF, Scher AI. Epidemiology and economic impact of migraine.
Gobel H, Petersen-Braun M, Soyka D. The epidemiology of headache in Germany: a nationwide survey of a representative sample on the basis of the headache classification of the International Headache Society.
Pryse-Phillips W, Findlay H, Tugwell P, et al. A Canadian population survey on the clinical, epidemiologic and societal impact of migraine and tension-type headache.
Merikangas KR, Whitaker AE, Isler H, et al. The Zurich Study: XXIII. Epidemiology of headache syndromes in the Zurich cohort study of young adults.
Strine TW, Chapman DP. Associations of frequent sleep insufficiency with health-related quality of life and health behaviors.

