


Abstract
Aims To test the prognostic value of ventricular late potentials (LPs) in a large cohort of post-infarction patients in the modern reperfusion era.
Methods and results 1800 consecutive survivors of acute myocardial infarction in sinus rhythm and under 76 years of age were enrolled. Many (99%) of the patients received reperfusion/revascularization therapy (91% percutaneous coronary intervention) and up-to-date pharmacological treatment (99% aspirin, 93% beta-blockers, 90% ACE-inhibitors, and 85% statins). LPs were calculated in 968 patients and found to be present in 90 (9.3%). The primary endpoint was the composite of cardiac death and serious arrhythmic events. The secondary endpoint was the composite of sudden cardiac death and serious arrhythmic events. During follow-up (median 34 months), 26 patients reached the primary endpoint. The presence of LPs was not significantly associated with the primary endpoint in univariable or multivariable analysis. In contrast, low (≤30%) left ventricular ejection fraction (hazard ratio 9.6, 95% confidence interval 4.1–22.4), heart rate turbulence category 2 (7.5, 2.4–23.9) and category 1 (5.3, 1.9–14.9) were significant predictors in both univariable and multivariable analysis.
Conclusion Ventricular LPs are of limited use for risk stratification in unselected post-infarction patients in the modern reperfusion era.
for the editorial comment on this article (doi:10.1093/eurheartj/ehi128)
Introduction
The identification of post-infarction patients at high risk of subsequent death remains a challenge.1 In recent years, many risk stratification methods have been evaluated, including ventricular late potentials (LPs). Most studies of the pre-thrombolytic era showed that both arrhythmic events and cardiac death could be predicted by LPs,2–5 although more recent studies have been inconclusive.6–12
Modern therapeutic strategies, such as immediate revascularization by percutaneous coronary intervention and subsequent long-term administration of aspirin, beta-blockers, ACE-inhibitors, and statins, have substantially reduced both early and late mortality, and may be a major cause of the discrepancies between older and newer studies. At this time, the prognostic value of LPs in post-infarction patients receiving up-to-date treatment is unknown. In this study, we therefore re-evaluate the efficacy of ventricular LPs as a predictor of late cardiac mortality and serious arrhythmic events in a modern patient population. It is a retrospective analysis of a recent study conducted to validate a risk stratification protocol which included left ventricular ejection fraction (LVEF), heart rate turbulence (HRT), and several other risk predictors in survivors of recent myocardial infarction (MI).13
Methods
Recruitment and follow-up
Patients of either sex, younger than 76 years of age, were enrolled between January 1996 and December 2000 if they had survived an acute MI within the last 4 weeks and were in sinus rhythm. Patients with bundle branch block morphology or marked intraventricular conduction delay (QRS duration ≥120 ms) in the standard ECG were excluded. Acute MI was diagnosed if there had been at least one episode of chest pain within the last 48 h lasting 20 min or longer, combined with either typical ECG changes (≥0.1 mV of ST segment elevation in ≥2 limb leads or 0.2 mV in ≥2 contiguous precordial leads) or with an increase of creatine kinase (CK) and its MB isoenzyme twice above the upper limit of normal. The institutional ethics committee approved the study protocol. Diabetes mellitus was considered present if a patient had been given this diagnosis and was receiving treatment (diet control, medication, or insulin), or if a blood glucose concentration of 11 mmol/L was repeatedly found. Minimum follow-up was 12 months with clinical appointments every 6 months. Patients who failed to meet these appointments were contacted by letter or telephone at corresponding intervals.
Endpoints of the study
In cases of death, the reasons for death were verified from hospital and autopsy records and from either the primary physicians or those who had witnessed the death. An endpoint committee defined the mode of death. Deaths were categorized as cardiac or non-cardiac deaths. In addition, cardiac deaths were categorized as sudden or non-sudden. Cardiac death was defined as sudden if it was (i) a witnessed death occurring within 60 min of the onset of new symptoms unless a cause other than cardiac was obvious, (ii) an unwitnessed death (<24 h) in the absence of pre-existing progressive circulatory failure or other causes of death, or (iii) death during attempted resuscitation.
The primary endpoint of this study was the composite of cardiac death (sudden and non-sudden) and serious arrhythmic events [successful resuscitation, sustained symptomatic ventricular tachycardia, appropriate implantable cardioverter defibrillator (ICD) intervention]. The secondary endpoint tested was the composite of sudden cardiac death and serious arrhythmic events.
Assessment of risk predictors
In order to avoid a multiple test problem, we restricted our analyses to three risk predictors, namely LPs, LVEF, and HRT. All variables were measured during the second week after the index infarction.
Ventricular LPs
LVEF
LVEF was assessed in single plane, 30° right anterior oblique projection technique using a digital angiographic system (Hicor, Siemens). LVEF was calculated by the area–length method. In 81 patients, LVEF was assessed by single-plane echocardiography using a phased-array system (Sonos 2000 and Sonos 5500, Hewlett Packard, USA). Calculation of LVEF was based on a modified Simpson rule algorithm in the apical four-chamber view. LVEF was prospectively dichotomized at a value of 30%, where patients with LVEF ≤30% were defined as having low LVEF. The cut-off value of 30% for LVEF was chosen because it was used in the Multicenter Automatic Defibrillator Implantation Trial (MADIT) II15 and in our previous post-infarction study.13
HRT
HRT was measured in 24-h Holter ECGs. The recordings were digitized at 128 Hz, and automatically processed using an Oxford Excel Holter system (Oxford Instruments, UK) or by a Pathfinder 700 system (Reynolds Medical, USA). The beat annotations (normal, ventricular ectopic, supraventricular ectopic, and unknown) were manually verified by an experienced technician. HRT categories 0, 1, and 2 were assigned according to previously published criteria.13,16
Statistical analysis
Continuous variables are presented as median and interquartile range (IQR) and qualitative data are expressed as percentages. The comparison of continuous variables was performed with the non-parametric Mann–Whitney U test. Dichotomized data were analysed with the χ2 test or, in case of small numbers, with Fisher's exact test. Mortality rates were estimated by the Kaplan–Meier method and compared using the log-rank test. The day of index infarction was defined as ‘Day 0’ of the follow-up period. Univariable and multivariable analyses were performed using the Cox proportional-hazards model. The proportional-hazards assumption was tested by means of Schoenfeld residuals using procedure stphtest in STATA (STATA, release 8.0) which is based on Grambsch and Thernau.17 Multivariable models were adjusted for patient age ≥65 years (yes/no), sex, history of a previous MI (yes/no), and presence of diabetes (yes/no). Hazard ratios are given with 95% confidence intervals. Tests in the Cox model and log rank tests were two-sided. Differences were considered to be statistically significant when P<0.05 (SPSS, Release 11.5, SPSS Inc.).
Results
During the recruitment period, 1800 consecutive patients were enrolled. Of these patients, the actual study population consists of the 968 in whom SAECG was performed. In the remaining 832 cases, SAECG was missing for various reasons (no consent, early discharge, transfer to another hospital, or technically insufficient recordings).
Clinical characteristics and therapy
Table 1 depicts the clinical characteristics of the study population (in whom an SAECG was performed) and of excluded patients. In the study population, median age was 58 years, 20% were women, 15% were diabetic, and 13% had a history of a previous MI. The median of the creatine kinase maximum (CKmax) was 556 U/L. Median LVEF was 57%, 5% of the patients had an LVEF of ≤30% and 13% had an LVEF of ≤40%. The inclusion criteria of the Multicenter Unsustained Tachycardia Trial (MUSTT),18 i.e. LVEF≤40% and the presence of non-sustained ventricular tachycardia, were fulfilled by 1.9% of the patients.
Excluded patients were older (61 years), more often female (26%), and suffered more frequently from diabetes mellitus (19%). Their median LVEF was identical to the study population at 57%. CKmax was lower (513 vs. 556 U/L).
In the study patients, percutaneous coronary intervention was performed in 91% of the patients (10% percutaneous transluminal coronary angioplasty alone, 81% percutaneous transluminal coronary angioplasty plus stenting), 6% received thrombolysis, and 2% underwent coronary artery bypass grafting. Thus, altogether, 99% of the patients received reperfusion/revascularization therapy. One per cent of the patients received none of these therapies because revascularization was deemed unnecessary or unreliable. Medication consisted of aspirin in 99%, beta-blockers in 93%, ACE-inhibitors in 90%, and statins in 85%. Thirty-six per cent of the patients were given diuretics.
Follow-up and outcome
Median follow-up period was 34 months, with an IQR of 26–37 months. Six patients were lost to follow-up. They were censored at the date of latest contact. Three of the six patients belonged to the study population. The range of the follow-up periods for the six patients was 15–31 days.
Table 2 lists the cumulative rates of death and serious arrhythmic events together with the cumulative rates of primary and secondary endpoints for the study population. Out of 968 patients, 20 patients suffered a cardiac death (sudden and non-sudden) and eight experienced serious arrhythmic events or appropriate ICD shocks. In two patients who experienced appropriate ICD shocks, and who died from cardiac causes 12 and 26 months after the first shock, only the former events were taken into consideration, so that altogether 26 patients (2.7%) reached the primary endpoint. Out of 832 excluded patients, 35 patients (4.2%) reached the primary endpoint. With univariable Cox regression analysis, the difference was statistically significant with a hazard ratio of 1.67 (1.0–2.8, P=0.048). However, after adjustment for age, sex, diabetes, history of previous MI, LVEF, and QRS width, the risk of reaching the primary endpoint was almost evenly distributed with a hazard ratio of 1.37 (0.79–2.39, P=0.26).
Association of risk predictors with mortality
Ventricular LPs were present in 90 patients (9.3%). Table 3 depicts the clinical characteristics of patients with negative and positive LPs. The latter patients were characterized by a higher prevalence of males, a history of previous MI, a lower LVEF, and a broader QRS complex. The presence of LP was not significantly associated with the primary endpoint in either univariable or multivariable analysis (Table 4). In univariable analysis, the hazard ratio for a positive LP was 2.3 and not statistically significant (95% confidence interval 0.9–6.1, P=0.095). In contrast, the hazard ratio for LVEF≤30% was 18.7 (8.6–40.4, P<0.0001), and for HRT categories 1 and 2, it was 7.0 (2.6–18.7, P<0.0001) and 18.1 (6.3–52.3, P<0.0001), respectively. In multivariable analysis, only LVEF and HRT categories 1 and 2 were significant and independent predictors of the primary endpoint. Their hazard ratios were 9.6 (4.1–22.4, P<0.0001), 5.3 (1.9–14.4, P=0.0011), and 7.5 (2.4–23.9, P=0.0006), respectively. None of the factors considered showed a statistically significant change of effect over time; that is, no deviation from the proportional hazards assumption was observed.
To rule out the possibility that the loss of predictive ability of positive LPs in multivariable analysis was due to the use of dichotomized LVEF, we repeated the multivariable analysis with LVEF as a continuous variable. This was found not to affect the results of the study (Table 5).
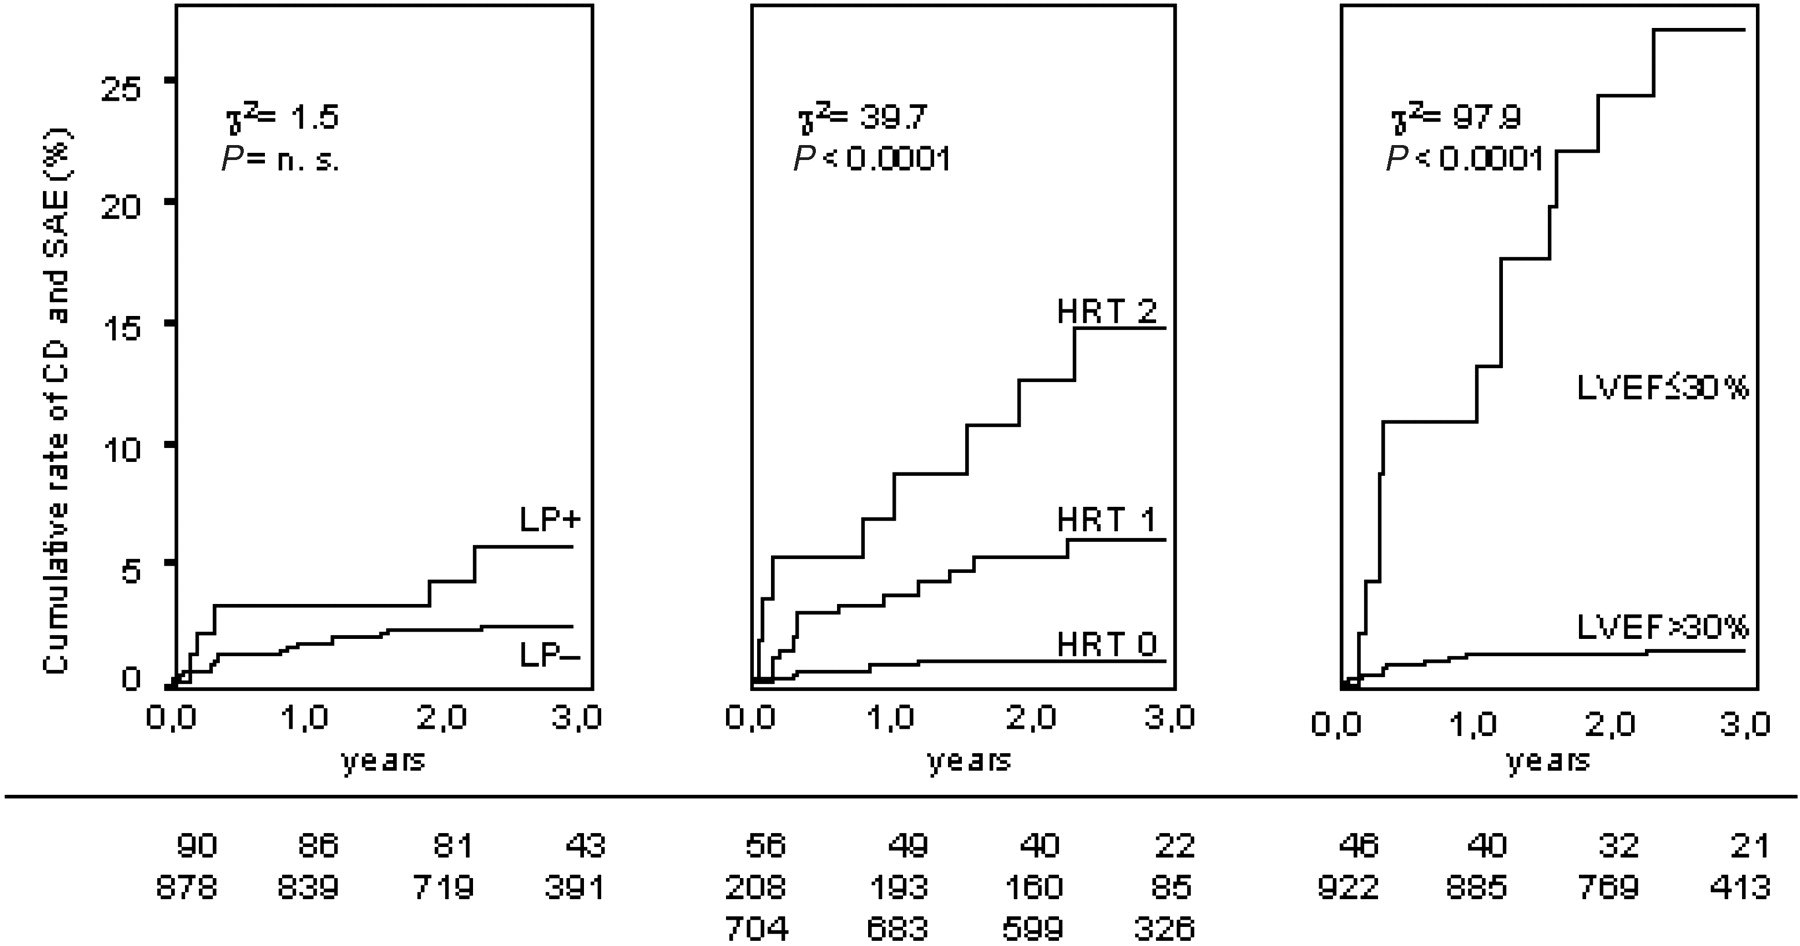
Figure 1 shows the cumulative rates of cardiac death and serious arrhythmic events for ventricular LPs, HRT categories, and LVEF groupings. In patients with positive LPs, the probability of reaching the primary endpoint at 3 years was 5.9% (five endpoints/90 patients) compared with 2.5% in patients with negative LPs (21 endpoints/878 patients). This difference did not reach statistical significance, whereas patients with poor HRT and LVEF had significantly higher mortality/arrhythmia rates than those with normal parameter values. In patients with HRT categories 0, 1, and 2, the endpoint probability was 0.9%, 6.2%, and 15.6%, respectively (P<0.0001). In patients with LVEF>30% and ≤30%, these figures were 1.6 and 27.3%, respectively (P<0.0001). For LPs, the negative predictive value was 97.6%, which was significantly lower than that of LVEF (98.5%, P<0.001) and HRT (99.1%, P<0.05).
We also analysed sudden cardiac death and serious arrhythmic events as a secondary endpoint. As Table 6 shows, the hazard ratio of LPs in the univariable analysis improved to 2.8 (as compared with 2.3 for primary endpoint), but not to the level of statistical significance (P=0.074). The hazard ratios of LVEF and HRT also improved.
Discussion
Our findings indicate that the predictive value of ventricular LPs for cardiac death, sudden and otherwise, and serious arrhythmic events has been lost or at least greatly reduced in the reperfusion era, when considering a generic post-MI population who present with sinus rhythm and normal QRS duration. On univariable analysis, the presence of LPs indicated a hazard ratio of 2.3 for the primary endpoint, with a significance level of P=0.095. Therefore, a larger patient population may have produced a significant association. On multivariable analysis, however, the presence of LPs conveyed no prognostic power at all. This statement holds true not only for the primary endpoint, but also for the secondary endpoint of this study, namely the composite of sudden cardiac death and serious arrhythmic events.
The first evidence for ventricular LPs was reported more than 20 years ago.19–21 The prognostic significance of positive LPs in survivors of recent MI was evaluated in several studies.2–5 The early studies of the pre-thrombolytic era consistently found that an abnormal SAECG indicated a significantly increased risk of sudden death, ventricular fibrillation, or sustained ventricular tachycardia.
Later studies of the thrombolytic era do not find such a clear association.22 The incidence of LP is lower,23–25 and this decrease has been paralleled by a decline in late mortality. In recent years it has been surmised that mechanical reperfusion of the infarction-related artery further contributes to the declining prevalence of ventricular LPs.26
To our knowledge, this is the first study to evaluate the prognostic power of LPs in consecutive, i.e. unselected, post-infarction patients undergoing mechanical revascularization. On average, the infarction size was relatively small (median CK 556 U/L, median LVEF 57%) and LPs infrequent (9.3% of the patients). During the 3-year follow-up period, only 20 patients died from cardiac causes and only eight patients suffered serious arrhythmic events. Compared with previous post-infarction studies this figure is extremely low. It may be due to the high percentage of successful reperfusion and receipt of beta-blocker therapy, because both are known to significantly reduce the incidence of sudden cardiac death.
With a decreasing number of endpoints, risk stratification becomes more and more difficult.8,23 However, we do not think that the lack of prognostic power of LPs can be attributed solely to the low incidence of sudden cardiac death and serious arrhythmic events in our infarction population, because the two other predictors tested, namely impaired left ventricular function and abnormal HRT, both demonstrated strong predictive powers.
Several publications have emphasized the high negative predictive value of ventricular LPs over other predictors.14 Even this observation was not confirmed in our study. The negative predictive value of LPs was significantly lower than that of LVEF and of HRT. Because of the critical dependence of such values on chosen thresholds of abnormality, we also repeated our analyses with other known criteria for the diagnosis of LPs, e.g. LPs positive if all three parameters are abnormal, or different cut-off values. Changing the criteria had no impact on the results.
A relatively high number of patients was excluded because of missing SAECG. In order to detect or exclude a selection bias as the source of our findings, the clinical characteristics and the follow-up status of the excluded patients were compared with those of the study population. Excluded patients had a higher probability of reaching the primary endpoint with a hazard ratio of 1.67 (1.0–2.8, P=0.048). However, after adjustment for important clinical variables, this difference diminished almost completely [hazard ratio 1.37 (0.79–2.39, P=0.26)]. Thus, selection bias as an explanation for the lack of predictive power of ventricular LPs is not probable.
Finally, LPs may well still be valid as a prognostic marker in selected high-risk patient populations, such as in patients with particular electrical abnormalities and poor ventricular function.18,27 For example, the inclusion criteria for the MUSTT trial, i.e. the combination of an LVEF of ≤40% and the presence of non-sustained ventricular tachycardia, were met by only 18 out of 968 patients (1.9%). Therefore, we cannot extrapolate our results to patients with diagnosed ventricular tachyarrhythmias.
Limitations
The subjects included in this study were younger than 76 years of age. Thus, the results cannot be extrapolated to older post-infarction patients. Moreover, it is possible that techniques for the assessment of ventricular LPs different from those used in this study could have led to a better prediction of cardiac mortality and serious arrhythmic events.
Conclusion
We have shown that the presence of ventricular LPs is of little value for predicting cardiac death and serious arrhythmic events in generic post-infarction patient populations receiving modern reperfusion therapy.
Acknowledgements
This study was supported by grants from the Bundesministerium für Bildung, Wissenschaft, Forschung und Technologie (no. 13N7073/7 to G.S.), from the Kommission für Klinische Forschung (to G.S.), and from the Deutsche Forschungsgemeinschaft (SFB 368 to K.U. and G.S.).
Both authors contributed equally to this work.

Figure 1 Cumulative rate of cardiac death (CD) and serious arrhythmic events (SAE) stratified to negative and positive ventricular LPs (left panel), to HRT categories 0, 1, and 2 (medium panel), and to LVEF >30% and ≤30% (right panel). Numbers of patients at risk at 0, 12, and 24 months are shown under the graphs.
Patient characteristics
| Patients with SAECG | Patients without SAECG | P | |
|---|---|---|---|
| n | 968 | 832 | |
| Age, years, median (IQR) | 58 (51–66) | 61 (53–68) | 0.0003 |
| Women, n (%) | 193 (20) | 220 (26) | 0.0011 |
| Diabetes mellitus, n (%) | 142 (15) | 162 (19) | 0.0067 |
| History of previous MI, n (%) | 125 (13) | 121 (15) | 0.32 |
| CKmax U/L, median (IQR) | 556 (288–1236) | 513 (244–1052) | 0.022 |
| LVEF, %, median (IQR) | 57 (48–64) | 57 (46–64) | 0.67 |
| LVEF≤30%, n (%) | 46 (5) | 37 (4) | 0.84 |
| LVEF≤40%, n (%) | 121 (13) | 89 (11) | 0.31 |
| QRS width, ms, median (IQR) | 97 (80–100) | 95 (80–100) | 0.46 |
Mortality, serious arrhythmic events, and endpoints in the study group
| Event | Number of events | Cumulative event rate at 3 years (%) |
|---|---|---|
| Non-cardiac death | 16 | 1.65 |
| Cardiac death | 20 | 2.07 |
| Sudden cardiac death | 10 | 1.03 |
| Appropriate ICD action | 6 | 0.62 |
| Serious arrhythmic event | 2 | 0.21 |
| Primary endpoint | 26 | 2.69 |
| Secondary endpoint | 18 | 1.86 |
Characteristics of patients with positive and negative LP
| LP-negative | LP-positive | P | |
|---|---|---|---|
| n | 878 | 90 | |
| Age, years, median (IQR) | 58 (51–66) | 58 (51–67) | 0.95 |
| Women, n (%) | 185 (21) | 8 (9) | 0.0059 |
| Diabetes mellitus, n (%) | 128 (15) | 14 (16) | 0.080 |
| History of previous MI, n (%) | 107 (12) | 18 (20) | 0.035 |
| CKmax, U/L, median (IQR) | 550 (283–1212) | 556 (350–1312) | 0.40 |
| LVEF, %, median (IQR) | 57 (48–64) | 54 (42–62) | 0.040 |
| LVEF≤30%, n (%) | 35 (4) | 11 (12) | 0.0005 |
| LVEF≤40%, n (%) | 99 (11) | 22 (24) | 0.0003 |
| QRS width, ms, median (IQR) | 90 (80–100) | 100 (90–100) | <0.0001 |
Association of risk variables with cardiac mortality and serious arrhythmic events in univariable and multivariable analysis
| Variable | Hazard ratio (univariable) | P | Hazard ratio (multivariable) | P |
|---|---|---|---|---|
| LVEF≤30% | 18.7 (8.6–40.4) | <0.0001 | 9.6 (4.1–22.4) | <0.0001 |
| HRT category 1 vs. 0 | 7.0 (2.6–18.7) | <0.0001 | 5.3 (1.9–14.4) | 0.0011 |
| HRT category 2 vs. 0 | 18.1 (6.3–52.3) | <0.0001 | 7.5 (2.4–23.9) | 0.0006 |
| LP (+) vs. LP (–) | 2.3 (0.9–6.1) | 0.095 | 1.3 (0.5–3.5) | 0.63 |
LVEF was used as a dichotomized variable. The multivariable analysis was adjusted for age of the patient, history of a previous MI, and the presence of diabetes mellitus.
Association of risk variables with cardiac mortality and serious arrhythmic events in univariable and multivariable analysis
| Variable | Hazard ratio (univariable) | P | Hazard ratio (multivariable) | P |
|---|---|---|---|---|
| LVEF (continuous variable) | 0.91 (0.88–0.93) | <0.0001 | 0.92 (0.90–0.95) | <0.0001 |
| HRT category 1 vs. 0 | 7.0 (2.6–18.7) | <0.0001 | 4.8 (1.8–13.1) | <0.002 |
| HRT category 2 vs. 0 | 18.1 (6.3–52.3) | <0.0001 | 6.8 (2.2–20.6) | <0.001 |
| LP (+) vs. LP (–) | 2.3 (0.9–6.1) | 0.095 | 1.2 (0.4–3.3) | 0.69 |
LVEF was used as a continuous variable. The multivariable analysis was adjusted for age of the patient, history of a previous MI, and the presence of diabetes mellitus.
Association of risk variables with sudden cardiac death and serious arrhythmic events in univariable and multivariable analysis
| Variable | Hazard ratio (univariable) | P | Hazard ratio (multivariable) | P |
|---|---|---|---|---|
| LVEF≤30% | 21.8 (8.6–54.9) | <0.0001 | 10.4 (3.8–28.3) | <0.0001 |
| HRT category 1 vs. 0 | 10.5 (2.9–38.9) | <0.0001 | 7.8 (2.1–29.4) | 0.0024 |
| HRT category 2 vs. 0 | 27.1 (6.8–108.6) | <0.0001 | 10.8 (2.4–48.0) | 0.0017 |
| LP (+) vs. LP (−) | 2.8 (0.9–8.4) | 0.074 | 1.5 (0.5–4.7) | 0.50 |
LVEF was used as a dichotomized variable. The multivariable analysis was adjusted for age of the patient, history of a previous MI, and the presence of diabetes mellitus.
References
Moss AJ. Dead is dead, but can we identify patients at increased risk for sudden cardiac death?
Breithardt G, Schwarzmaier J, Borggrefe M, Haerten K, Seipel L. Prognostic significance of late ventricular potentials after acute myocardial infarction.
Denniss AR, Richards DA, Cody DV, Russell PA, Young AA, Cooper MJ, Ross DL, Uther JB. Prognostic significance of ventricular tachycardia and fibrillation induced at programmed stimulation and delayed potentials detected on the signal-averaged electrocardiograms of survivors of acute myocardial infarction.
Gomes JA, Winters SL, Stewart D, Horowitz S, Milner M, Barreca P. A new noninvasive index to predict sustained ventricular tachycardia and sudden death in the first year after myocardial infarction: based on signal-averaged electrocardiogram, radionuclide ejection fraction and Holter monitoring.
Kuchar DL, Thorburn CW, Sammel NL. Prediction of serious arrhythmic events after myocardial infarction: signal-averaged electrocardiogram, Holter monitoring and radionuclide ventriculography.
Pedretti R, Etro MD, Laporta A, Braga SS, Caru B. Prediction of late arrhythmic events after acute myocardial infarction from combined use of noninvasive prognostic variables and inducibility of sustained monomorphic ventricular tachycardia.
Hohnloser SH, Franck P, Klingenheben T, Zabel M, Just H. Open infarct artery, late potentials, and other prognostic factors in patients after acute myocardial infarction in the thrombolytic era. A prospective trial.
Kawalsky DL, Garratt KN, Hammill SC, Bailey KR, Gersh BJ. Effect of infarct-related artery patency and late potentials on late mortality after acute myocardial infarction.
Touboul P, Andre-Fouet X, Leizorovicz A, Itti R, Lopez M, Sayegh Y, Milon H, Kirkorian G. Risk stratification after myocardial infarction. A reappraisal in the era of thrombolysis. The Groupe d'Etude du Pronostic de l'Infarctus du Myocarde (GREPI).
Savard P, Rouleau JL, Ferguson J, Poitras N, Morel P, Davies RF, Stewart DJ, Talajic M, Gardner M, Dupuis R, Lauzon C, Sussex B, Potvin L, Warnica W. Risk stratification after myocardial infarction using signal-averaged electrocardiographic criteria adjusted for sex, age, and myocardial infarction location.
Tapanainen JM, Still AM, Airaksinen KE, Huikuri HV. Prognostic significance of risk stratifiers of mortality, including T wave alternans, after acute myocardial infarction: results of a prospective follow-up study.
Huikuri HV, Tapanainen JM, Lindgren K, Raatikainen P, Makikallio TH, Juhani Airaksinen KE, Myerburg RJ. Prediction of sudden cardiac death after myocardial infarction in the beta-blocking era.
Barthel P, Schneider R, Bauer A, Ulm K, Schmitt C, Schomig A, Schmidt G. Risk stratification after acute myocardial infarction by heart rate turbulence.
Cain ME, Anderson JL, Arnsdorf MF, Mason JW, Scheinman MM, Waldo AL. ACC Consensus Document on Signal-Averaged Electrocardiography.
Moss AJ, Zareba W, Hall WJ, Klein H, Wilber DJ, Cannom DS, Daubert JP, Higgins SL, Brown MW, Andrews ML. Prophylactic implantation of a defibrillator in patients with myocardial infarction and reduced ejection fraction.
Schmidt G, Malik M, Barthel P, Schneider R, Ulm K, Rolnitzky L, Camm AJ, Bigger JT, Jr, Schomig A. Heart-rate turbulence after ventricular premature beats as a predictor of mortality after acute myocardial infarction.
Grambsch P, Thernau T. Proportional hazards tests and diagnostics based on weighted residuals.
Buxton AE, Lee KL, Fisher JD, Josephson ME, Prystowsky EN, Hafley G. A randomized study of the prevention of sudden death in patients with coronary artery disease. Multicenter Unsustained Tachycardia Trial Investigators.
Berbari EJ, Scherlag BJ, Hope RR, Lazzara R. Recording from the body surface of arrhythmogenic ventricular activity during the S-T segment.
Breithardt G, Seipel L, Ostermeyer J, Karbenn U, Abendroth RR, Borggrefe M, Yeh HL, Bircks W. Effects of antiarrhythmic surgery on late ventricular potentials recorded by precordial signal averaging in patients with ventricular tachycardia.
Simson MB, Untereker WJ, Spielman SR, Horowitz LN, Marcus NH, Falcone RA, Harken AH, Josephson ME. Relation between late potentials on the body surface and directly recorded fragmented electrograms in patients with ventricular tachycardia.
Camm AJ. Programmed electrical stimulation, the signal-averaged electrocardiogram, and the implantable cardioverter-defibrillator in ventricular arrhythmias.
Gang ES, Lew AS, Hong M, Wang FZ, Siebert CA, Peter T. Decreased incidence of ventricular late potentials after successful thrombolytic therapy for acute myocardial infarction.
Zimmermann M, Adamec R, Ciaroni S. Reduction in the frequency of ventricular late potentials after acute myocardial infarction by early thrombolytic therapy.
Karam C, Golmard J, Steg PG. Decreased prevalence of late potentials with mechanical versus thrombolysis-induced reperfusion in acute myocardial infarction.
Lomama E, Helft G, Persoz A, Vacheron A. Relation between successful late coronary angioplasty of an occluded, infarction-related artery and lower prevalence of ventricular late potentials.

