


Abstract
Aims Current treatment may have changed the risk profiles of survivors of acute myocardial infarction (AMI). We evaluated the utility of Holter-based risk variables in the prediction of sudden cardiac death (SCD) among survivors of AMI treated with modern therapy.
Methods and results A total of 2130 AMI patients (mean age 59±10 years) were included. The patients were treated with modern therapeutic strategies, for example, 94% were on β-blocking therapy and 70% underwent coronary revascularization. Various risk parameters from Holter monitoring were analysed. During a median follow-up of 1012 days (interquartile range: 750–1416 days), cardiac mortality was 113/2130, including 52 SCDs. All Holter variables predicted the occurrence of SCD (P<0.01), but only reduced post-ectopic turbulence slope (TS) (P<0.001) and non-sustained ventricular tachycardia (P<0.01) remained as marked SCD predictors after adjustment for age, diabetes, and ejection fraction (EF). In a subgroup analysis, none of the Holter variables predicted SCD among those with an EF ≤0.35, but many variables predicted SCD among those with an EF >0.35, particularly TS (hazard ratio 5.9; 95% CI 2.9–11.7, P<0.001).
Conclusion Among the post-AMI patients treated according to the current guidelines, the incidence of SCD is low. Various Holter variables still predict the occurrence of SCD, particularly among the patients with preserved left ventricular function.
Introduction
Several previous randomized trials have shown that prophylactic implantation of a cardioverter-defibrillator (ICD) will result in a mortality benefit for patients with reduced left ventricular (LV) systolic function.1–3 Despite the positive trial-based evidence of prophylactic ICD implantation, its widespread usage has not been generally advocated, possibly because of the relatively low accuracy of LV ejection fraction (EF) in specific prediction of sudden cardiac death (SCD), which results in unnecessary implantation of ICD in a large proportion of patients and relatively high costs of this therapy.4–7 There is an obvious need for other risk markers of SCD, in addition to the measurement of EF, that could enhance the predictive power.
Holter-based risk variables have been suggested to be useful for screening patients at risk for SCD among survivors of acute myocardial infarction (AMI).4 However, the clinical utility of Holter monitoring together with the measurement of EF is not well known, because previous studies have been designed for endpoints of total or cardiac mortality rather than SCD, and have thus been underpowered for the purpose of SCD prediction.4 Furthermore, the predictive power of arrhythmia risk variables, based on studies of populations without optimal treatment, may no longer be valid among patients treated with therapies that were not available at the time of these studies.
In order to achieve sufficient power for SCD prediction, we combined two large contemporary post-AMI populations. The goal of our study was to evaluate various Holter variables in predicting SCD risk. We also wanted to investigate whether these variables provide prognostic information among patients with and without depressed LV systolic function.
Methods
Population
A series of 2130 post-AMI patients comprised the population of the present study involving two centres in FINland and GERmany (FINGER), including a series of AMI patients recruited at the Division of Cardiology, University of Oulu, Oulu, Finland (n=675) and at Deutsches Herzzentrum München and 1 Medizinische Klinik der Technischen Universität München, Munich, Germany (n=1455). Patient recruitment was conducted during 1996–2000 in both centres. The aim was to study the predictive power of Holter-based risk variables as predictors of SCD among survivors of AMI treated according to the contemporary guidelines. The patients were recruited to participate after a diagnosis of AMI, which was confirmed by using the contemporary guidelines at the beginning of data collection.8,9 The qualifying diagnosis and the inclusion and exclusion criteria have been previously described in detail.8,9 A total of 2130 consecutive patients (472 females and 1658 males, mean age 59±10 years) with AMI fulfilled the inclusion criteria. Patients >75 years of age at baseline were excluded. The predictive power of heart rate (HR) dynamics for the total mortality of the German patients8 and the predictive power of conventional HR variability indices for the SCD of the Finnish patients have been published earlier.9
Special emphasis was placed on compliance with cardiac medication and AMI treatment according to the contemporary guidelines. In the total study population, β-blocking drugs were used by 2008 (94%) patients, aspirin by 1997 (94%) patients, angiotensin-converting enzyme inhibitors by 1567 (74%) patients, and statins by 1459 (69%) patients. Revascularization therapy by primary angioplasty or coronary bypass grafting was used for 1495 (70%) patients; 304 (14%) patients with ST-segment elevation AMI who did not undergo primary angioplasty were treated with thrombolytic therapy. Only 114 (5%) patients who developed Q wave AMI were treated without acute revascularization owing to absolute or relative contraindications for the treatment. All patients gave informed consent, and the ethics committees of the participating institutions approved the study. The medical treatment of patients was uniform between the two centres.
Risk factor analyses
All risk factors were assessed during the second week after infarction. The assessment techniques have been previously described in detail.10,11 LV systolic function was measured with 2D echocardiography or ventriculography. Whenever LV systolic function was measured with a wall motion index, EF was estimated by a previously described method.12,13 EF was prospectively dichotomized at <0.35 vs. >0.35. A 24 h ECG recording was carried out after AMI using an Oxford Holter system (Oxford Instruments, Abingdon, UK) or a Pathfinder 700 system (Reynolds Medical, Hertford, UK). The number of episodes of non-sustained ventricular tachycardia (nsVT) and the number of ventricular premature beats were counted. The standard deviation of all normal-to-normal R–R intervals (SDNN) measured from the 24 h recording was chosen as a conventional time domain index of HR variability, and a value of <70 ms was pre-defined as abnormal.11,14 The spectral measures of HR variability were analysed using the methods recommended by the Task Force,14 and the cut-off values of reduced spectral indexes were also predefined.15
Two newer Holter-based risk variables, namely, HR turbulence slope (TS) and short-term fractal-like scaling exponent (α1), were computed in addition to SDNN. Post-ectopic HR turbulence was analysed according to a previously published method.8,10 TS was defined as the maximum slope of the regression line assessed over any sequence within five subsequent sinus R–R intervals during the first 15 sinus beats following an ectopic beat. TS was calculated from the averaged R–R intervals preceding and following the ventricular premature beats relatively in each subject. A TS value of ≤2.5 ms/per normal-to-normal interval was predefined as abnormal.
Short-term fractal-like scaling exponent was computed by the detrended fluctuation analysis technique. This method is a modified root-mean-square analysis of random walk, which quantifies the presence or absence of fractal-like correlation properties. The root-mean-square fluctuation of integrated and detrended time series is measured in different observation windows and plotted against the size of the observation window on a log–log scale. The details of this method have been described elsewhere.16,17 The HR correlations (scaling exponent) were defined for short-term (<11 beats, α1) unedited R–R interval data on the basis of the previous findings of prognostic power with this risk parameter.17 An exponent value of <0.75 was predefined as abnormal.
QRS duration was measured between days 5 and 14 from cycles on a standard 12-lead surface ECG recorded at a speed of 50 mm/ms. QRS duration ≥120 ms was considered abnormal.
Follow-up and endpoints
The patients were followed up for median 1012 days (interquartile range: 750–1416 days) after the AMI. In cases of death, the causes were verified from the hospital and autopsy records and from either the primary physicians or those who had witnessed the death. The endpoint committees of the participating institutes defined the modes of death. Deaths were defined as cardiac and non-cardiac deaths. In addition, cardiac deaths were defined as sudden or non-sudden. Cardiac death was defined as sudden if it was (i) a witnessed death occurring within 60 min from the onset of new symptoms unless a cause other than cardiac was obvious, (ii) an unwitnessed death (<24 h) in the absence of pre-existing progressive circulatory failure or other causes of death, or (iii) death during attempted resuscitation.
Statistical analysis
The primary endpoint of this study was SCD. A sample size of 2130 patients with an average follow-up of 1012 days was based on the assumptions that the annual incidence of the primary endpoint may vary from 0.5 to 4% in the current treatment era. A minimal number of 30 endpoints were evaluated to be needed for reliable SCD analysis. To accomplish a valid analysis even in the case of low SCD rate, the databases of the two participant centres were combined.
The data were analysed using the SPSS software (SPSS 11.0, SPSS Inc. Chicago, IL, USA). Survival curves were estimated by Kaplan–Meier method, with comparisons of cumulative endpoints based on logarithmic transformations. Multivariate analyses were performed using the Cox proportional-hazards model and adjusted with the significant clinical risk factors (diabetes, age, and LV function) as well as with the country of the patient. The effects of the factors investigated are given as hazard ratios with 95% confidence intervals. All statistical tests including log-rank tests in the Cox model, were two-sided and assessed at the 5% significance level. The cut-off points for risk variables were pre-defined on the basis of cut-off points used in previous studies.10,11,14,15,17 Analyses were also conducted using risk variables as continuous variables when it was possible. In addition to risk analysis in the total study population, pre-defined subgroup analysis was carried out separately for patients with EF ≤0.35 and for those with EF >0.35.
Results
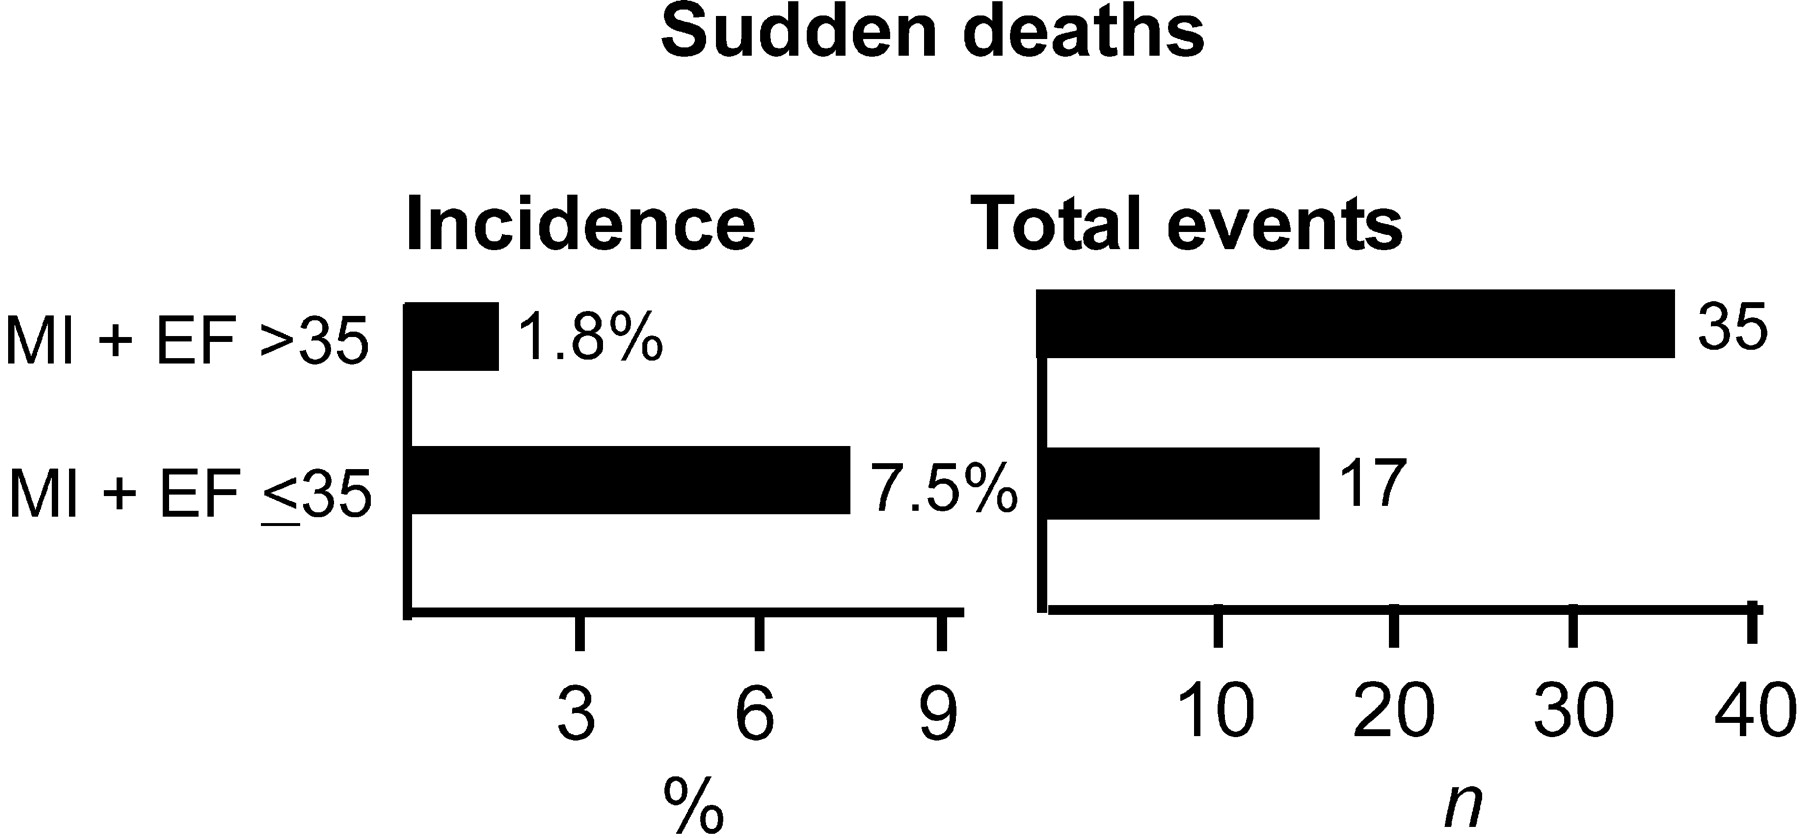
The clinical characteristics of the patient population are listed in Table 1. During a median follow-up of 1012 days, total number of deaths was 191. Of these deaths, 113 were cardiac and 78 were non-cardiac. Of the cardiac deaths, 61 were non-SCDs and 52 were SCDs. The annual incidence of SCD was 0.8%. The incidence of SCD was higher among patients with EF ≤0.35 than among those with EF >0.35, but the number of events was higher among the patients with EF >0.35 than in those with EF ≤0.35 (Figure 1).
Predictors of mortality in the total study population
The hazard ratios of the various risk variables for SCD and non-SCD are listed in Table 2. In univariate analysis, various Holter-based risk indices, including nsVT, SDNN, spectral measures of HR variability, HR turbulence, and fractal HR variability index, were associated with an increased risk of SCD and non-SCD (Table 2). High-frequency spectral power did not provide any prognostic information. In multivariable analysis after adjustment for age, LV systolic function, and history of diabetes, abnormal TS, presence of nsVT, and fractal α1 predicted both SCD and non-SCD.
Subgroup analysis of patients with depressed and preserved LV function
Table 3 lists the hazard ratios of the various risk variables for SCD and non-SCD in the subgroups of patients with EF ≤0.35 and EF >0.35. Among patients with EF ≤0.35, none of the Holter variables predicted the occurrence of SCD, whereas non-SCD was predicted by many Holter variables (Table 3). Among patients with EF >0.35, abnormal TS, spectral measures, nsVT, α1, and QRS duration predicted SCD in univariate analysis. In multivariable analysis, these variables also remained predictors of SCD after adjustments for clinical variables (Table 3). Abnormal TS was a particularly powerful predictor of SCD among the patients with preserved LV function. The risk of experiencing SCD among patients with EF >0.35 but abnormal TS was even higher than of those with EF ≤0.35 (Tables 2 and 3; Figure 2).
Predictive accuracy of risk variables in predicting SCD
Sensitivity level of >30% in SCD prediction was achieved with positive predictive accuracy of 7.5% (17 SCDs among 226 patients) by measurement of LV function alone (EF ≤0.35). Among patients with EF >0.35, the combination of TS with EF resulted in a similar level of positive predictive accuracy, and the combination of TS ≤2.5 ms/RRI and EF>0.35 but ≤0.50 detected a patient group with as high risk for SCD (15 SCDs among 198 patients) as among the patients with depressed EF alone. Among patients with EF ≤0.35, combination of different risk variables did not improve the predictive accuracy significantly (Table 4).
Discussion
This study showed that among the post-AMI patients treated according to the current guidelines the incidence of SCD is low, but the abnormal Holter variables still predict the occurrence of SCD. Holter variables did not seem to improve the prediction of SCD among patients with reduced LV function (EF<0.35), but provided prognostic information among those with a slightly reduced or preserved LV function. This patient group also comprised a larger number of SCD events than those with impaired LV function.
Various Holter variables as predictors of SCD and non-SCD
Concurrently with previous studies, all HR variability indexes, except the high-frequency spectral component of HR variability, predicted both the SCD and the non-SCD in univariate analysis.18–21 In accordance with a recent report,9 SDNN, a traditional measure of HR variability, failed to provide independent prognostic information about SCD. However, reduced very-low frequency and low frequency spectral components did provide prognostic information. These spectral measures also were somewhat better predictors of non-SCD than of SCD.
Reduced α1, which has previously shown to be a strong predictor of mortality among post-AMI patients17 was also a more powerful predictor of non-SCD than of SCD. Another newer index of HR variability, HR turbulence, was a powerful predictor of SCD in the present study. TS performed better in this respect than the turbulence onset. HR turbulence has been shown to be a powerful predictor in risk stratification also in previous studies,8,10 but none of these studies has specifically assessed its performance in predicting the occurrence of SCD in post-AMI populations.
The occurrence of nsVT in Holter recordings has been shown to predict mortality in several previous post-AMI studies.22–24 This measure has been used as an inclusion criterion in studies investigating the value of prophylactic ICD implantation among post-MI patients.1,2 The present study confirms the predictive value of nsVT in the modern treatment era. It predicted both SCD and non-SCD in the present analysis. Taken together, TS, spectral measures, and nsVT seem to provide information about the risk of future SCD, particularly among patients with slightly reduced or preserved LV function in the current treatment era.
Clinical utility of Holter monitoring in risk stratification
Several randomized trials have shown that prophylactic ICD will result in mortality benefit for patients with reduced EF.1–3 Because of the relatively high costs of this therapy and the relatively low accuracy of EF alone in the prediction of SCD, there is still an obvious need for new risk markers of SCD that could enhance the predictive power in addition to EF measurement. Combination of various risk variables has been proposed to provide clinically useful information in this respect,25 but these analyses are based on populations studied without currently recommended optimized therapy. In this respect, the present results were somewhat disappointing, because none of the Holter variables could independently predict the occurrence of SCD among patients with EF ≤0.35.
Despite the lack of predictive power of Holter variables among patients with impaired LV function, several variables predicted SCD among those with slightly reduced or preserved LV function. This observation has some clinical importance, because there has been limited information on the predictors of SCD among these patients, which account for a larger number of events than those with impaired LV function.26–29 Abnormal nsVT, reduced spectral components, and particularly TS identified a relatively large portion of patients who subsequently died suddenly among the patients with slightly reduced or preserved LV function.
The reason why many Holter variables predicted SCD only among the patients with slightly reduced or preserved LV systolic function remains speculative. It is possible that many patients with less severely reduced LV function (EF>0.35) have abnormalities in their cardiovascular function and regulation, for example, diastolic dysfunction, leading to neuro-hormonal activation. This activation may be reflected as altered autonomic regulation of HR dynamics and electrical vulnerability, resulting in abnormal short-range HR variability values, that is, blunted TS and the occurrence of nsVT, and predispose the patients to life-threatening arrhythmias.
Potential limitations
To our knowledge, this is the largest observational study where the risk markers of SCD have been meticulously analysed among post-AMI patients with modern treatment. However, the observational nature of the study design may cause an endpoint bias and not allow definite conclusions to be reached about the clinical utility of the Holter variables as specific predictors of arrhythmic death. It is still possible that some of the deaths defined as non-sudden might have been preventable by the ICD. Therefore, only randomized ICD trials can give more definite answers about the true value of Holter monitoring in risk stratification.
Conclusions and Implications
The present data do not support the view that either new or more traditional Holter variables are useful in SCD risk stratification among patients with depressed LV function in the modern treatment era of post-AMI patients. However, some Holter variables provide information about the risk of future SCD among the patients with slightly reduced or preserved LV function. The risk of SCD was similar among patients with abnormal Holter and EF >0.35 than among those with EF ≤0.35. Therefore, future efforts should also be directed towards interventions aimed at reducing premature SCD among patients with slightly reduced or preserved LV function and abnormal autonomic regulation of HR.
Acknowledgements
Supported by the Medical Council of the Academy of Science, Helsinki, Finland; the Foundation for Cardiovascular Research, the Paulo Foundation, and the Paavo Nurmi Foundation, Helsinki, Finland; Bundesministerium für Bildung, Wissenschaft, Forschung und Technologie, Berlin, Germany; Kommission für Klinische Forschung, Munich, Germany; and Deutsche Forschungsgemeinschaft, Bonn, Germany. G.S. is the holder of an HRT patent licensed to GE Medical. None of the other authors have any conflict of interest.
These authors have contributed equally to this work.
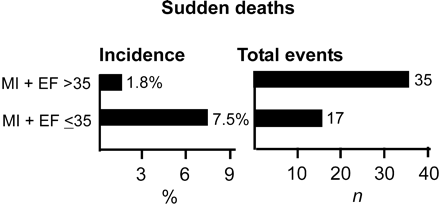
Figure 1 Incidence and total numbers of SCD in patients with depressed LV systolic function and in patients with preserved LV function. The incidence of SCD is higher among patients with poor LV systolic function when compared with those with preserved LV function, but the total number of SCDs is higher in patients with preserved LV function.
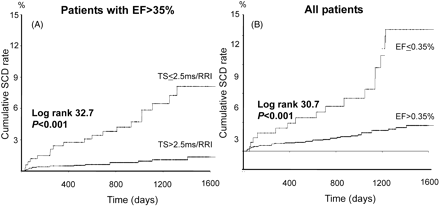
Figure 2 Kaplan–Meier survival curves for SCD among patients with abnormal TS but preserved LV function (A) and in total study population with depressed and preserved LV systolic function, respectively (B). Abnormal TS was a powerful predictor of SCD death among patients with preserved LV function, detecting patients with as high risk for SCD as patients with depressed LV function.
Clinical characteristics of the study population
| Clinical features | (n=2130) |
|---|---|
| Age (years) | 59±10 |
| Sex (m/f) | 1658/472 |
| Smoking (ex or current) | 1272 (60) |
| Diabetes | 401 (19) |
| Prior MI | 270 (13) |
| Hypertension | 1240 (58) |
| Type of MI | |
| Anterior | 984 (46) |
| Inferior | 780 (37) |
| Lateral | 366 (17) |
| MI treatment | |
| PTCA or CABG | 1495 (70) |
| PTCA | 1411 (66) |
| CABG | 84 (4) |
| Thrombolysis, but no PTCA or CABG | 304 (14) |
| Q wave MI developed but no acute revascularization | 114 (5) |
| Medical treatment | |
| Aspirin or warfarin | 2000 (94) |
| β-blockers | 2011 (94) |
| Statins | 1463 (69) |
| ACE-inhibitors/AT II blockers | 1571 (74) |
| Ca-channel blockers | 85 (4) |
| Diuretic | 719 (34) |
Data are presented as n(%). ACE, angiotensin-converting enzyme; AT II, angiotensin II receptor; CABG, coronary artery bypass grafting; PTCA, percutaneous coronary angioplasty; f, female; m, male; MI, myocardial infarction.
Arrhythmia risk variables as predictors of SCD and non-SCD
| SCD (n=52) | Non-SCD (n=61) | |||
|---|---|---|---|---|
| HR (95% Cl) | P-value | HR (95% Cl) | P-value | |
| Univariate analysis | ||||
| EF≤0.35 | 4.5 (2.5–8.0) | 0.0000 | 7.2 (4.3–12.1) | 0.0000 |
| EF (continuous) | 0.94 (0.92–0.96) | 0.0000 | 0.92 (0.90–0.94) | 0.0000 |
| Holter | ||||
| nsVT | 3.3 (1.7–6.5) | 0.0005 | 2.8 (1.5–5.5) | 0.0020 |
| VPCs>10/h | 2.4 (1.3–4.4) | 0.0049 | 3.8 (2.3–6.6) | 0.0000 |
| SDNN<70 ms | 2.4 (1.3–4.3) | 0.0048 | 2.6 (1.5–4.6) | 0.0007 |
| SDNN (continuous) | 0.98 (0.97–0.99) | 0.0006 | 0.98 (0.97–0.99) | 0.0000 |
| ln VLF<5.3 | 3.0 (1.3–6.7) | 0.0072 | 4.4 (2.2–8.9) | 0.0000 |
| ln VLF (continuous) | 0.59 (0.47–0.74) | 0.0000 | 0.52 (0.42–0.64) | 0.0000 |
| ln LF<3.85 | 2.9 (1.8–6.1) | 0.0145 | 7.0 (3.7–13.4) | 0.0000 |
| ln LF (continuous) | 0.62 (0.50–0.76) | 0.0000 | 0.54 (0.46–0.65) | 0.0000 |
| TS (≤2.5 ms/RRI) | 4.6 (2.6–8.1) | 0.0000 | 6.7 (3.8–11.8) | 0.0000 |
| TS (continuous) | 0.80 (0.73–0.89) | 0.0000 | 0.78 (0.70–0.86) | 0.0000 |
| DFA (α1<0.75) | 3.4 (1.9–6.1) | 0.0000 | 5.4 (3.1–9.4) | 0.0000 |
| DFA (continuous) | 0.19 (0.07–0.52) | 0.0014 | 0.14 (0.05–0.36) | 0.0001 |
| ECG markers | ||||
| QRS ≥120 ms | 3.3 (1.7–6.5) | 0.0004 | 5.2 (3.0–9.1) | 0.0000 |
| QRS (continuous) | 1.00 (0.99–1.01) | 0.0873 | 1.00 (1.00–1.01) | 0.0080 |
| Multivariable analysisa | ||||
| Holter | ||||
| nsVT | 2.9 (1.5–5.8) | 0.0018 | 2.3 (1.2–4.5) | 0.0071 |
| VPCs >10/h | 1.4 (0.7–2.8) | 0.3421 | 2.4 (1.4–4.5) | 0.0013 |
| SDNN<70 ms | 1.4 (0.7–2.6) | 0.2995 | 1.4 (0.8–2.6) | 0.2221 |
| SDNN (continuous) | 0.99 (0.98–1.00) | 0.0842 | 0.99 (0.98–0.99) | 0.0077 |
| ln VLF<5.3 | 1.4 (0.6–3.3) | 0.3603 | 1.8 (0.9–3.8) | 0.1261 |
| ln VLF (continuous) | 0.75 (0.57–0.98) | 0.0319 | 0.69 (0.53–0.90) | 0.0055 |
| ln LF<3.85 | 1.4 (0.6–3.3) | 0.4881 | 3.0 (1.5–6.0) | 0.0026 |
| ln LF (continuous) | 0.76 (0.60–0.97) | 0.0246 | 0.69 (0.53–0.90) | 0.0055 |
| TS (<2.5 ms/RRI) | 2.9 (1.6–5.5) | 0.0008 | 3.2 (1.7–5.9) | 0.0007 |
| TS (continuous) | 0.83 (0.75–0.92) | 0.0006 | 0.85 (0.77–0.95) | 0.0048 |
| DFA (α1<0.75) | 1.9 (1.0–3.6) | 0.0444 | 2.9 (1.6–5.5) | 0.0007 |
| DFA (continuous) | 0.38 (0.11–1.26) | 0.1140 | 0.15 (0.05–0.46) | 0.0007 |
| ECG markers | ||||
| QRS ≥ 120 ms | 1.9 (0.9–3.9) | 0.0562 | 2.6 (1.4–4.7) | 0.0016 |
| QRS (continuous) | 1.00 (1.00–1.01) | 0.5752 | 1.00 (1.00–1.01) | 0.1391 |
HR, hazard ratio; VPC, ventricular premature complex; ln, natural logarithm; VLF, very low frequency; LF, low frequency; DFA, detrended fluctuation analysis.
aHazard ratio assessed by Cox regression analysis including age, diabetes, LV systolic function, and country of the patient as covariates.
Arrhythmia risk variables as predictors of SCD and non-SCD in patients with and without severely depressed LV function
| EF ≤ 35% (n=226) | EF > 35% (n=1904) | |||||||
|---|---|---|---|---|---|---|---|---|
| SCD (n=17) | Non-SCD (n=26) | SCD (n=35) | Non-SCD (n=35) | |||||
| HR (95% Cl) | P-value | HR (95% Cl) | P-value | HR (95% Cl) | P-value | HR (95% Cl) | P-value | |
| Univariate analysis | ||||||||
| nsVT | 1.8 (0.6–5.4) | 0.3177 | 2.8 (1.2–6.5) | 0.0167 | 3.5 (1.5–8.1) | 0.0030 | 1.3 (0.4–4.6) | 0.5794 |
| VPCs>10/h | 2.2 (0.8–6.3) | 0.1366 | 2.5 (1.0–5.7) | 0.0345 | 1.3 (0.5–3.4) | 0.5683 | 3.4 (1.6–7.6) | 0.0022 |
| SDNN<70 ms | 1.2 (0.5–3.2) | 0.3177 | 2.2 (0.9–5.5) | 0.3177 | 2.0 (0.9–4.5) | 0.0628 | 1.1 (0.4–2.9) | 0.8418 |
| SDNN (continuous) | 1.00 (0.99–1.02) | 0.7499 | 0.98 (0.96–1.00) | 0.0292 | 0.98 (0.97–0.99) | 0.0025 | 0.98 (0.97–1.00) | 0.0288 |
| ln VLF<5.3 | 0.8 (0.2–3.7) | 0.8031 | 2.4 (1.0–6.0) | 0.0513 | 4.2 (1.6–10.9) | 0.0032 | 2.9 (0.9–9.6) | 0.0855 |
| ln VLF (continuous) | 1.19 (0.71–1.99) | 0.5039 | 0.62 (0.41–0.94) | 0.0240 | 0.54 (0.42–0.70) | 0.0000 | 0.57 (0.43–0.77) | 0.0002 |
| ln LF<3.85 | 0.8 (0.2–3.5) | 0.7484 | 3.8 (1.6–9.1) | 0.0034 | 4.0 (1.4–11.7) | 0.0097 | 4.4 (1.5–12.8) | 0.0065 |
| ln LF (continuous) | 1.19 (0.71–1.99) | 0.5039 | 0.59 (0.39–0.90) | 0.0129 | 0.56 (0.45–0.70) | 0.0000 | 0.60 (0.46–0.77) | 0.0001 |
| TS (<2.5 ms/RRI) | 1.2 (0.4–3.4) | 0.7059 | 3.5 (1.3–9.6) | 0.0128 | 5.9 (2.9–11.7) | 0.0000 | 5.1 (2.4–10.6) | 0.0000 |
| TS (continuous) | 1.00 (0.99–1.02) | 0.7499 | 0.79 (0.62–1.01) | 0.0619 | 0.77 (0.68–0.87) | 0.0000 | 0.82 (0.73–0.93) | 0.0012 |
| DFA (α1<0.75) | 1.3 (0.5–3.6) | 0.5574 | 2.8 (1.1–7.1) | 0.0297 | 3.6 (1.8–7.4) | 0.0003 | 4.1 (2.0–8.6) | 0.0001 |
| DFA (continuous) | 0.31 (0.59–1.61) | 0.1622 | 0.21 (0.05–0.92) | 0.0389 | 0.23 (0.06–0.85) | 0.0280 | 0.32 (0.08–1.27) | 0.1057 |
| QRS ≥ 120 ms | 1.1 (0.3–3.9) | 0.8670 | 2.8 (1.3–6.2) | 0.0111 | 4.4 (2.0–9.7) | 0.0003 | 4.0 (1.7–9.3) | 0.0011 |
| QRS (continuous) | 1.00 (0.99–1.02) | 0.6647 | 1.01 (1.00–1.03) | 0.0480 | 1.00 (1.00–1.00) | 0.2037 | 1.00 (1.00-.1.00) | 0.3227 |
| Multivariable analysisa | ||||||||
| NsVT | 2.1 (0.7–6.7) | 0.2010 | 3.1 (1.3–6.3) | 0.0085 | 3.5 (1.5–8.2) | 0.0021 | 1.3 (0.4–4.3) | 0.4505 |
| VPCs > 10/h | 1.9 (0.7–5.4) | 0.3322 | 2.2 (0.9–5.2) | 0.0746 | 1.2 (0.5–3.1) | 0.7345 | 2.8 (1.2–6.2) | 0.0088 |
| SDNN<70 ms | 1.3 (0.5–3.4) | 0.6148 | 2.3 (0.9–5.8) | 0.0689 | 1.5 (0.7–3.4) | 0.3074 | 0.8 (0.3–2.0) | 0.5124 |
| SDNN (continuous) | 1.00 (0.98–1.02) | 0.7733 | 0.98 (0.96–1.00) | 0.0235 | 0.99 (0.97–1.00) | 0.0292 | 0.99 (0.98–1.00) | 0.2541 |
| ln VLF<5.3 | 0.8 (0.2–3.9) | 0.7996 | 2.6 (0.9–5.6) | 0.0588 | 2.7 (1.0–7.1) | 0.0505 | 1.5 (0.5–5.1) | 0.5044 |
| ln VLF (continuous) | 1.26 (0.75–2.11) | 0.3726 | 0.65 (0.42–1.00) | 0.0477 | 0.62 (0.46–0.82) | 0.0008 | 0.74 (0.51–1.07) | 0.1128 |
| ln LF<3.85 | 0.7 (0.2–3.4) | 0.6979 | 3.7 (1.5–9.2) | 0.0046 | 2.6 (0.9–7.9) | 0.0826 | 2.1 (0.7–6.3) | 0.1932 |
| ln LF (continuous) | 1.24 (0.79–1.95) | 0.3450 | 0.59 (0.38–0.90) | 0.0146 | 0.63 (0.50–0.81) | 0.0002 | 0.76 (0.56–1.02) | 0.0707 |
| TS (≤2.5 ms/RRI) | 1.0 (0.4–2.1) | 0.9310 | 3.0 (1.1–8.3) | 0.0350 | 4.7 (2.3–9.8) | 0.0001 | 2.4 (1.1–5.3) | 0.0340 |
| TS (continuous) | 1.04 (0.89–1.21) | 0.6418 | 0.81 (0.63–1.04) | 0.1011 | 0.77 (0.67–0.88) | 0.0001 | 0.89 (0.79–1.00) | 0.0507 |
| DFA (α1<0.75) | 1.0 (0.4–2.7) | 0.5123 | 2.3 (0.9–6.1) | 0.0811 | 2.7 (1.3–5.7) | 0.0088 | 2.8 (1.2–5.9) | 0.0084 |
| DFA (continuous) | 1.53 (0.13–17.4) | 0.7317 | 0.14 (0.02–0.84) | 0.0316 | 0.26 (0.06–1.10) | 0.0673 | 0.20 (0.05–0.84) | 0.0283 |
| QRS ≥ 120 ms | 0.9 (0.3–3.1) | 0.9843 | 2.6 (1.2–5.9) | 0.0201 | 3.2 (1.4–7.3) | 0.0039 | 2.8 (1.2–6.6) | 0.0173 |
| QRS (continuous) | 1.00 (0.98–1.02) | 1.0000 | 1.01 (1.00–1.02) | 0.0838 | 1.00 (1.00–1.00) | 0.4845 | 1.00 (1.00–1.00) | 0.4063 |
HR, hazard ratio; for other abbreviations see Table 2.
aHazard ratio assessed by Cox regression analysis including age, diabetes, and country of the patient as covariates.
Sensitivity, specificity, positive and negative predictive accuracy of different variables as predictors of SCD
| Sensitivity (%) | Specificity (%) | Positive predictive accuracy (%) | Negative predictive accuracy (%) | |
|---|---|---|---|---|
| All patients | ||||
| EF≤0.35 | 33 | 90 | 7.5 | 98 |
| TS (≤2.5 ms/RRI) | 56 | 79 | 6.0 | 99 |
| nsVT | 21 | 92 | 4.5 | 98 |
| Patients with EF≤0.35 | ||||
| TS (≤2.5 ms/RRI) | 53 | 51 | 7.6 | 93 |
| nsVT | 24 | 85 | 11 | 93 |
| TS+nsVT | 12 | 94 | 13 | 93 |
| Patients with EF>0.35 | ||||
| TS (≤2.5 ms/RRI) | 57 | 82 | 5.5 | 99 |
| nsVT | 21 | 93 | 5.3 | 98 |
| TS+nsVT | 11 | 98 | 11 | 98 |
| EF between 0.35 and 0.50 | ||||
| TS (≤2.5 ms/RRI) | 60 | 73 | 7.6 | 98 |
| nsVT | 24 | 91 | 8.6 | 97 |
| TS+nsVT | 15 | 98 | 19 | 97 |
References
Moss AJ, Hall WJ, Cannom DS et al. Improved survival with an implanted defibrillator in patients with coronary disease at high risk for ventricular arrhythmia.
Buxton AE, Lee KL, Fisher JD et al. A randomized study of the prevention of sudden death in patients with coronary artery disease. Multicenter Unsustained Tachycardia Trial Investigators.
Moss AJ, Zareba W, Hall WJ et al. Prophylactic implantation of a defibrillator in patients with myocardial infarction and reduced ejection fraction. Multicenter Automatic Defibrillator Implantation Trial II Investigators.
Huikuri HV, Mäkikallio TH, Raatikainen MJ et al. Prediction of sudden cardiac death: appraisal of the studies and methods assessing the risk of sudden arrhythmic death.
Ezekowitz JA, Armstrong PW, McAlister FA. Implantable cardioverter defibrillators in primary and secondary prevention: a systematic review of randomized, controlled trials.
Buxton AE. The clinical use of implantable cardioverter defibrillators: Where are we now? Where should we go?
Reynolds MR, Josephson ME. MADIT II (Second multicenter automated defibrillator implantation trial) debate: risk stratification, costs, and public policy.
Barthel P, Schneider R, Bauer A et al. Risk stratification after acute myocardial infarction by heart rate turbulence.
Huikuri HV, Tapanainen JM, Lindgren KS et al. Prediction of sudden cardiac death after myocardial infarction in the beta-blocking era.
Schmidt G, Malik M, Barthel P et al. Heart-rate turbulence after ventricular premature beats as a predictor of mortality after acute myocardial infarction.
Tapanainen JM, Still A-M, Airaksinen KEJ et al. Prognostic significance of risk stratifiers of mortality, including T wave alternans, after acute myocardial infarction: results of a prospective follow-up study.
Berning J, Steensgaard-Hansen F. Early estimation of risk by echocardiographic determination of wall motion index in an unselected population with acute myocardial infarction.
Kober L, Torp-Pedersen C, Elming H et al. Use of left ventricular ejection fraction or wall motion score index in predicting arrhythmic death in patients following an acute myocardial infarction. The TRACE study group.
Task Force of the European Society of Cardiology and the North American Society of Pacing and Electrophysiology: heart rate variability: standards of measurements, physiological interpretation, and clinical use.
Tapanainen JM, Block-Thomsen PE, Kober L et al. Fractal analysis of heart rate variability and mortality after an acute myocardial infarction.
Peng CK, Havlin S, Stanley HE et al. Quantification of scaling exponents and crossover phenomena in nonstationary heartbeat time series.
Huikuri HV, Mäkikallio TH, Peng CK et al. Fractal correlation properties of R-R interval dynamics and mortality in patients with depressed left ventricular function after an acute myocardial infarction.
Kleiger RE, Miller JP, Bigger JT et al. The Multicenter Post-infarction Research Group. Decreased heart rate variability and its association with increased mortality after myocardial infarction.
Bigger JT Jr., Fleiss JL, Steinman RC et al. Frequency domain measures of heart period variability and mortality after myocardial infarction.
Zuanetti G, Neilson JM, Latini R et al. Prognostic significance of heart rate variability in post-myocardial infarction patients in the fibrinolytic era. The GISSI-2 results.
LaRovere MT, Bigger J T, Marcus F I et al. for the ATRAMI. Baroreflex sensitivity and heart rate variability in prediction of total cardiac mortality after myocardial infarction.
Bigger JT Jr, Fleiss JL, Kleiger R et al. The relationships among ventricular arrhythmias, left ventricular dysfunction, and mortality in the 2 years after myocardial infarction.
Maggioni AP, Zuanetti G, Franzosi MG et al. Prevalence and prognostic significance of ventricular arrhythmias after acute myocardial infarction in the fibrinolytic era. GISSI-2 results.
Hohnloser SH, Klingenheben T, Zabel M et al. Prevalence, characteristics and prognostic value during long-term follow-up of nonsustained ventricular tachycardia after myocardial infarction in the thrombolytic era.
Bailey JJ, Berson AS, Handelsman H et al. Utility of current risk stratification tests for predicting major arrhythmic events after myocardial infarction.
Huikuri HV, Castellanos A, Myerburg RJ. Sudden death due to cardiac arrhythmias.
Myerburg RJ, Interian A Jr, Mitrani RM, et al. Frequency of sudden cardiac death and profiles of risk.
Myerburg RJ, Kessler KM, Castellanos A. Sudden cardiac death. Structure, function, and time-dependence of risk.

