
Main menu

  • Home
  • Content
    • Current
    • Ahead of print
    • Archive
  • Info for
    • Authors
    • Reviewers
  • About Us
    • About the Ochsner Journal
    • Editorial Board
  • More
    • Alerts
    • Feedback
  • Other Publications
    • Ochsner Journal Blog

User menu

  • My alerts
  • Log in

Search

  • Advanced search
Ochsner Journal
  • Other Publications
    • Ochsner Journal Blog
  • My alerts
  • Log in
Ochsner Journal

Advanced Search

  • Home
  • Content
    • Current
    • Ahead of print
    • Archive
  • Info for
    • Authors
    • Reviewers
  • About Us
    • About the Ochsner Journal
    • Editorial Board
  • More
    • Alerts
    • Feedback
Research ArticleOriginal Research

Body Composition in Coronary Heart Disease: How Does Body Mass Index Correlate With Body Fatness?

Alban De Schutter, Carl J. Lavie, Jose Gonzalez and Richard V. Milani
Ochsner Journal September 2011, 11 (3) 220-225;
Alban De Schutter
*Department of Cardiovascular Diseases, John Ochsner Heart and Vascular Institute, Ochsner Clinic Foundation, New Orleans, LA
†The Department of Internal Medicine, Cleveland Clinic Florida, Weston, FL
MD
  • Find this author on Google Scholar
  • Find this author on PubMed
  • Search for this author on this site
Carl J. Lavie
*Department of Cardiovascular Diseases, John Ochsner Heart and Vascular Institute, Ochsner Clinic Foundation, New Orleans, LA
‡Ochsner Clinical School, The University of Queensland School of Medicine, New Orleans, LA
MD
  • Find this author on Google Scholar
  • Find this author on PubMed
  • Search for this author on this site
Jose Gonzalez
†The Department of Internal Medicine, Cleveland Clinic Florida, Weston, FL
MD
  • Find this author on Google Scholar
  • Find this author on PubMed
  • Search for this author on this site
Richard V. Milani
*Department of Cardiovascular Diseases, John Ochsner Heart and Vascular Institute, Ochsner Clinic Foundation, New Orleans, LA
‡Ochsner Clinical School, The University of Queensland School of Medicine, New Orleans, LA
MD
  • Find this author on Google Scholar
  • Find this author on PubMed
  • Search for this author on this site
  • Article
  • Figures & Data
  • References
  • Info & Metrics
  • PDF
Loading

Abstract

Background Despite its many known shortcomings, body mass index (BMI) is the most widely used measure of obesity, in part because of its practicality. Other more physiologic measurements of obesity have been proposed, including percent body fat (BF). Few studies have compared BMI and BF, especially in patients with coronary heart disease (CHD).

Methods We studied 581 patients with CHD following major CHD events. We divided patients into low (≤ 25% in men and ≤ 35% in women) and high BF (> 25% in men and > 35% in women) as determined by the sum of the skin-fold method and compared these findings with standard BMI determinations.

Results BMI and BF were highly correlated (r  =  0.60; P < .001) and classified patients in the same category (obese vs nonobese) in 68% of cases. The agreement was optimal in the underweight (BMI < 18.5 kg/m2) and obese class II category (BMI 35-39.9 kg/m2), in which 100% of patients were classified as nonobese and obese, respectively, by both BMI and BF categories. The performance was worst in patients with BMIs in the overweight or preobese range (25-29.9 kg/m2), in which 58% of patients would be classified as obese according to BF criteria.

Conclusions Although some CHD patients are classified differently by BMI and BF, especially within the overweight BMI group, in general BMI and BF are highly correlated, especially in the underweight and obese BMI groups. Prospective studies are needed to determine which index of obesity best predicts risk in primary and secondary prevention.

Keywords
  • Aging
  • body composition
  • coronary heart disease
  • fat
  • sex
  • obesity
  • rehabilitation

INTRODUCTION

According to the World Health Organization (WHO),1 in 2005 approximately 1.6 billion adults were overweight and about 400 million were obese; the WHO projects that by 2015 2.3 billion adults will be overweight and more than 700 million will be obese. In the United States alone, it is estimated that nearly 68% of adults are overweight and 35% are obese. Overweight and obesity accounted for 9.1% of total US medical expenditures in 1998 and may have reached as high as $78.5 billion ($492.6 billion in 2002 dollars) with approximately half of this amount paid by Medicare.2,3

Obesity has been defined in terms of body mass index (BMI) when associated with various comorbidities: hypertension,4-⇓6 type 2 diabetes,7,8 coronary heart disease (CHD),9,10 stroke, gallbladder disease,11 and sleep apnea. On the other hand, WHO defines overweight and obesity in terms of fat: “abnormal or excessive fat accumulation that may impair health.” Although BMI is the most frequently used method to assess body composition, it does not always reflect body fatness, especially in certain populations.12,13 In fact, some studies14 suggest that BMI underestimates the prevalence of obesity. Because of differences in body composition, some experts have considered the percent body fat (BF) more appropriate in defining obesity,15 and BF > 25% in men or > 35% in women has been recommended for defining obesity in a major endocrinology society's guideline statement.16

Several studies have examined the relationship between BMI and body composition; Wellens et al17 found that BMI correctly identified about 44% of obese men and 52% of obese women when obesity was determined from BF (using densitometry) in a population of 504 men and 511 women ages 20-45 years. Frankenfield et al18 used bioelectrical impedance and found that all individuals determined to be obese by BMI were, in fact, obese by BF; however, 36% of men and 46% of women with BMI below 30 kg/m2 had obesity levels using BF, suggesting that BMI may not be an adequate assessment of body fatness.19-⇓⇓⇓⇓⇓⇓26

In the present study, we examine the concordance of BMI and BF in classifying overweightness/obesity in a population with stable CHD. In addition, we examine the correlation between BMI and BF, as well as the factors that influence this correlation.

METHODS

Patients

We retrospectively reviewed records of 581 patients who attended our cardiac rehabilitation and exercise training program following major CHD events. We gathered demographic, lipid, and clinical data as previously described.27-⇓⇓⇓⇓⇓⇓⇓⇓36 We divided patients into low BF or nonobese (≤ 25% men and ≤ 35% women) and high BF or obese (> 25% in men and > 35% in women) as described above. At the same time, we divided the population into 6 groups based on the WHO BMI thresholds. The goal was to examine the BF-BMI correlation and compare how the patients would be classified differently according to BMI and BF. The study was approved by the Institutional Review Board at Ochsner Clinic Foundation, New Orleans, LA.

Protocol

At baseline, fasting plasma lipids, glucose, high-sensitivity C-reactive protein, and percent BF were measured. All measurements were made in the early morning before exercise; BF was assessed by the sum of the skin-fold method using an average of 3 skin folds—thigh, chest, and abdomen in men; thigh, triceps, and supra-iliac in women.37 Cardiopulmonary exercise testing was performed as previously described.38,39 Subjects were divided into obese and nonobese according to BMI and according to BF.

Statistical Analysis

SAS 9.0 (SAS Institute, Cary, NC) was used for the statistical analysis. Results are mean ± standard deviation or frequencies expressed as percentages. Pearson's correlation was used to determine correlation, and a scatterplot was generated with 95% confidence ellipse.

RESULTS

Baseline Characteristics

We found 581 patients with both BMI and percent BF measured. Table 1 summarizes baseline characteristics of this study population. The group was 27% females and had a mean age of 64 ± 11 years. A history of hypertension was present in 34%, 24% had diabetes, and only 1.3% admitted to being a current smoker.

View this table:
  • View inline
  • View popup
  • Download powerpoint
Table 1. 

Baseline Characteristics of the Population

Correlations

Overall, we found a strong statistically significant correlation (r  =  0.60; P < .001) between BMI and percent BF (Figure). The correlations in the subgroups were statistically significant (P < .0001) in older and younger patients, in both the obese and nonobese, and across both sexes (Table 2).

Figure.
  • Download figure
  • Open in new tab
  • Download powerpoint
Figure.

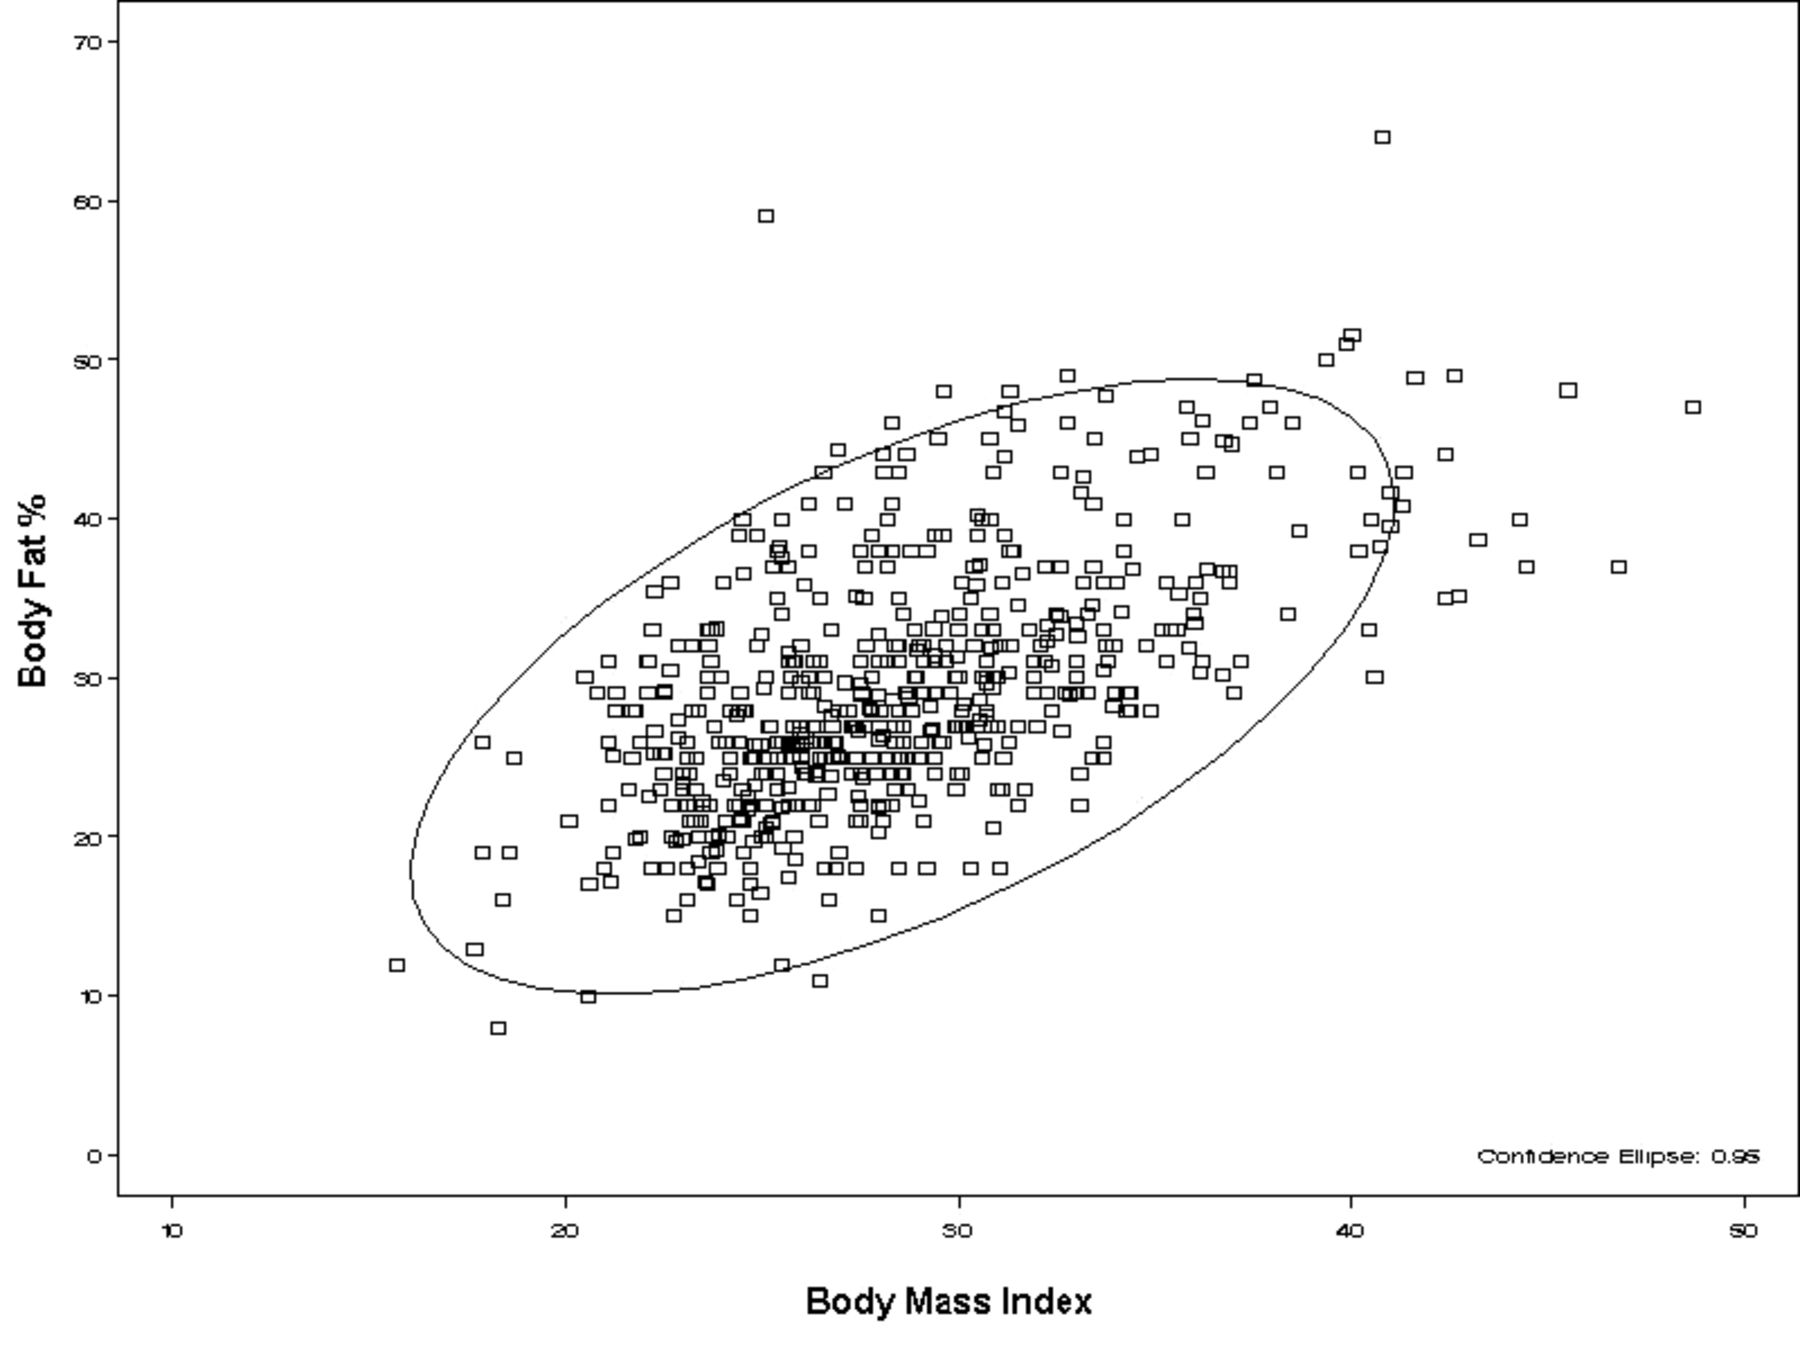
Scatter plot showing the correlation between body fat and body mass index.

View this table:
  • View inline
  • View popup
  • Download powerpoint
Table 2. 

Pearson Correlations for Population by Age (cutoff of 65) and Sex

Classifications

Overall, both classifications labeled subjects similarly in 68% of cases, 223 patients in the low BF group and 174 patients in the high BF group (Table 3). Using percent BF, 244 (42%) subjects were labeled as nonobese, 21 (9%) of whom were labeled as obese using BMI criteria. The other 337 (58%) subjects were labeled as obese according to BF, but 163 (48%) of these did not meet criteria for obesity according to BMI. The vast majority of the differently classified subjects—the 137 overweight patients (74%)—had a BMI of 25-30 kg/m2. In both the low BF and the high BF groups, 182 (99%) of misclassified subjects had BMI of 18.5-35 kg/m2. Two subjects had BMI ≥ 40 kg/m2 but were classified as nonobese by BF. BMI classified 195 (34%) subjects as obese, while BF classified 337 (58%) subjects as obese.

View this table:
  • View inline
  • View popup
  • Download powerpoint
Table 3. 

Agreement Between Established Categories of BMI and Percent BF

DISCUSSION

Correlation of BF and BMI

The correlation of BF and BMI seems to be dependent on multiple factors, including race, sex, age, and BMI itself.40-⇓42 In the Heritage Family Study, Jackson et al43 found that for similar BMIs, percent BF could vary as much as 10% between the sexes. Gallagher et al44 observed statistically significant age differences in all the studied groups. Movsesyan et al45 also saw this result in a study of Danish women.

The variations in the relationship between BMI and percent BF in different ethnic populations46 has led researchers to examine many different ethnic subgroups.47-⇓⇓⇓⇓⇓53 Some propose lower BMI cutoffs for Asian subgroups.14,54 The Heritage Family Study showed that the variation between races is larger for women than for men.43 BMI itself can also influence this relationship: In the severely obese, the gap between BMI and BF increases.22,23 These findings were also apparent in our study of patients with stable CHD (Table 3), although we did not have information regarding race.

BMI or BF in Defining Obesity

The BMI-based definition of obesity classified fewer people as obese than did the percent BF method, raising the question whether BMI or BF should be the gold standard for assessing body composition. Some ethnic populations have low BMIs and high BF and have a higher CHD prevalence than their low BF counterparts.55 Stroke has been associated with percent BF rather than BMI.56 Similarly, adiposity is associated with gallstone formation.57

Although we used a relatively simple and inexpensive assessment of BF (the sum of the skin-fold method), this method may not be as accurate as more sophisticated options. There is not a single, universally accepted method for assessing body composition.58 However, dual-energy x-ray absorptiometry (DEXA) has become one of the most widely used methods for estimating BF percentage because of its rapid, relatively easy operation and accuracy.59 Air displacement plethysmography,60-⇓62 bioelectrical impedance,63-⇓65 and hydrostatic weighing66,67 are other commonly used techniques. All of these methods, however, require significant financial and time investments, and none can easily be performed in the typical outpatient setting. These drawbacks explain why large epidemiologic studies still use BMI.

Different equations17,21,43,44,68,69 have been proposed to predict BF based on BMI in different populations—trying to account for age, sex, and ethnicity—with varying success.43,70 Such equations demonstrated the above-mentioned dependence of BMI and BF on multiple factors, especially age and sex, and they represent a relatively useful tool in classifying individuals as overweight and obese. Our study in CHD patients demonstrates that BMI and BF classifications are generally well correlated, especially with the extremes of BMI, although significant variability exists, especially in the middle BMI ranges.

Limitations

This study had multiple limitations. First, the study group was based on eligibility for cardiac rehabilitation and thus may not be representative. Second, our population had relatively high BMI and BF. Third, we measured BF using the skin-fold method, which is not considered to be the most accurate technique to determine BF.37 Last, our population mainly included older patients (mean age 64 ± 11 years), a group for which BMI and BF overlap to a lesser extent.20

CONCLUSIONS

Although BMI and BF correlate closely, their relationship depends on age, sex, ethnicity, and the exact level of BMI. BMI and BF often differ in classifying subjects as obese, with BMI tending to less often identify people as obese than the WHO percent BF classification. Further studies are needed to determine what body composition measurement best predicts risk in primary and secondary prevention of CHD.

This article meets the Accreditation Council for Graduate Medical Education competencies for Patient Care and Medical Knowledge.

  • Academic Division of Ochsner Clinic Foundation

REFERENCES

  1. 1.↵
    1. Flegal KM,
    2. Carroll MD,
    3. Ogden CL,
    4. Curtin LR
    (2010) Prevalence and trends in obesity among US adults, 1999-2008. JAMA 303(3):235–241, pmid:20071471.
    OpenUrlCrossRefPubMed
  2. 2.↵
    1. Finkelstein EA,
    2. Fiebelkorn IC,
    3. Wang G
    (2003) National medical spending attributable to overweight and obesity: how much, and who's paying. Health Aff (Millwood) Suppl Web Exclusives:W3-219–W3-226, pmid:14527256.
    OpenUrlAbstract/FREE Full Text
  3. 3.↵
    1. Finkelstein EA,
    2. Fiebelkorn IC,
    3. Wang G
    (2004) State-level estimates of annual medical expenditures attributable to obesity. Obes Res 12(1):18–24, pmid:14742838.
    OpenUrlCrossRefPubMed
  4. 4.↵
    1. Brown CD,
    2. Higgins M,
    3. Donato KA,
    4. et al.
    (2000) Body mass index and the prevalence of hypertension and dyslipidemia. Obes Res 8(9):605–619, pmid:11225709.
    OpenUrlCrossRefPubMed
  5. 5.↵
    1. Stamler R,
    2. Stamler J,
    3. Riedlinger WF,
    4. Algera G,
    5. Roberts RH
    (1978) Weight and blood pressure. Findings in hypertension screening of 1 million Americans. JAMA 240(15):1607–1610, pmid:691146.
    OpenUrlCrossRefPubMed
  6. 6.↵
    1. Dyer AR,
    2. Elliott P
    (1989) The INTERSALT study: relations of body mass index to blood pressure. INTERSALT Co-operative Research Group. J Hum Hypertens 3(5):299–308, pmid:2810326.
    OpenUrlPubMed
  7. 7.↵
    1. Chan JM,
    2. Rimm EB,
    3. Colditz GA,
    4. Stampfer MJ,
    5. Willett WC
    (1994) Obesity, fat distribution, and weight gain as risk factors for clinical diabetes in men. Diabetes Care 17(9):961–969, pmid:7988316.
    OpenUrlAbstract/FREE Full Text
  8. 8.↵
    1. Ohlson LO,
    2. Larsson B,
    3. Svärdsudd K,
    4. et al.
    (1985) The influence of body fat distribution on the incidence of diabetes mellitus. 13.5 years of follow-up of the participants in the study of men born in 1913. Diabetes 34(10):1055–1058, pmid:4043554.
    OpenUrlAbstract/FREE Full Text
  9. 9.↵
    1. Health implications of obesity
    (1985) National Institutes of Health Consensus Development Conference Statement. Ann Intern Med 103(6 Pt 2):1073–1077, pmid:4062128.
    OpenUrlCrossRefPubMed
  10. 10.↵
    1. Hubert HB,
    2. Feinleib M,
    3. McNamara PM,
    4. Castelli WP
    (1983) Obesity as an independent risk factor for cardiovascular disease: a 26-year follow-up of participants in the Framingham Heart Study. Circulation 67(5):968–977, pmid:6219830.
    OpenUrlAbstract/FREE Full Text
  11. 11.↵
    1. Stampfer MJ,
    2. Maclure KM,
    3. Colditz GA,
    4. Manson JE,
    5. Willett WC
    (1992) Risk of symptomatic gallstones in women with severe obesity. Am J Clin Nutr 55(3):652–658, pmid:1550039.
    OpenUrlAbstract/FREE Full Text
  12. 12.↵
    1. De Lorenzo A,
    2. Deurenberg P,
    3. Pietrantuono M,
    4. Di Daniele N,
    5. Cervelli V,
    6. Andreoli A
    (2003) How fat is obese. Acta Diabetol 40(Suppl 1):S254–S257, pmid:14618486.
    OpenUrlCrossRefPubMed
  13. 13.↵
    1. Deurenberg-Yap M,
    2. Schmidt G,
    3. van Staveren WA,
    4. Deurenberg P
    (2000) The paradox of low body mass index and high body fat percentage among Chinese, Malays and Indians in Singapore. Int J Obes Relat Metab Disord 24(8):1011–1017, pmid:10951540.
    OpenUrlCrossRefPubMed
  14. 14.↵
    1. Lanham DA,
    2. Stead MA,
    3. Tsang K,
    4. Davies PS
    (2001) The prediction of body composition in Chinese Australian females. Int J Obes Relat Metab Disord 25(2):286–291, pmid:11410833.
    OpenUrlPubMed
  15. 15.↵
    1. Poirier P
    (2007) Adiposity and cardiovascular disease: are we using the right definition of obesity. Eur Heart J 28(17):2047–2048, pmid:17673449.
    OpenUrlCrossRefPubMed
  16. 16.↵
    1. Dickey RA,
    2. Bartuska CD,
    3. Bray GW,
    4. et al.
    (1998) AACE/ACE position statement on the prevention, diagnosis, and treatment of obesity (1998 revision). Endocr Pract 4(5):297–350.
    OpenUrl
  17. 17.↵
    1. Wellens RI,
    2. Roche AF,
    3. Khamis HJ,
    4. Jackson AS,
    5. Pollock ML,
    6. Siervogel RM
    (1996) Relationships between the Body Mass Index and body composition. Obes Res 4(1):35–44, pmid:8787936.
    OpenUrlPubMed
  18. 18.↵
    1. Frankenfield DC,
    2. Rowe WA,
    3. Cooney RN,
    4. Smith JS,
    5. Becker D
    (2001) Limits of body mass index to detect obesity and predict body composition. Nutrition 17(1):26–30, pmid:11165884.
    OpenUrlCrossRefPubMed
  19. 19.↵
    1. Gallagher D,
    2. Heymsfield SB,
    3. Heo M,
    4. Jebb SA,
    5. Murgatroyd PR,
    6. Sakamoto Y
    (2000) Healthy percentage body fat ranges: an approach for developing guidelines based on body mass index. Am J Clin Nutr 72(3):694–701, pmid:10966886.
    OpenUrlAbstract/FREE Full Text
  20. 20.↵
    1. Deurenberg P,
    2. van der Kooy K,
    3. Hulshof T,
    4. Evers P
    (1989) Body mass index as a measure of body fatness in the elderly. Eur J Clin Nutr 43(4):231–236, pmid:2661215.
    OpenUrlPubMed
  21. 21.↵
    1. Deurenberg P,
    2. Weststrate JA,
    3. Seidell JC
    (1991) Body mass index as a measure of body fatness: age- and sex-specific prediction formulas. Br J Nutr 65(2):105–114, pmid:2043597.
    OpenUrlCrossRefPubMed
  22. 22.↵
    1. Baumgartner RN,
    2. Heymsfield SB,
    3. Roche AF
    (1995) Human body composition and the epidemiology of chronic disease. Obes Res 3(1):73–95, pmid:7712363.
    OpenUrlPubMed
  23. 23.↵
    1. Adams TD,
    2. Heath EM,
    3. LaMonte MJ,
    4. et al.
    (2007) The relationship between body mass index and per cent body fat in the severely obese. Diabetes Obes Metab 9(4):498–505, pmid:17587392.
    OpenUrlPubMed
  24. 24.↵
    1. Wang J,
    2. Gallagher D,
    3. Thornton JC,
    4. et al.
    (2007) Regional body volumes, BMI, waist circumference, and percentage fat in severely obese adults. Obesity (Silver Spring) 15(11):2688–2698, pmid:18070760.
    OpenUrlPubMed
  25. 25.↵
    1. Romero-Corral A,
    2. Somers VK,
    3. Sierra-Johnson J,
    4. et al.
    (2007) Diagnostic performance of body mass index to detect obesity in patients with coronary artery disease. Eur Heart J 28(17):2087–2093, pmid:17626030.
    OpenUrlCrossRefPubMed
  26. 26.↵
    1. Romero-Corral A,
    2. Somers VK,
    3. Sierra-Johnson J,
    4. et al.
    (2008) Accuracy of body mass index in diagnosing obesity in the adult general population. Int J Obes (Lond) 32(6):959–966, pmid:18283284.
    OpenUrlCrossRefPubMed
  27. 27.↵
    1. Lavie CJ,
    2. Milani RV
    (1994) Patients with high baseline exercise capacity benefit from cardiac rehabilitation and exercise training programs. Am Heart J 128(6 Pt 1):1105–1109, pmid:7985590.
    OpenUrlCrossRefPubMed
  28. 28.↵
    1. Lucini D,
    2. Milani RV,
    3. Costantino G,
    4. Lavie CJ,
    5. Porta A,
    6. Pagani M
    (2002) Effects of cardiac rehabilitation and exercise training on autonomic regulation in patients with coronary artery disease. Am Heart J 143(6):977–983, pmid:12075252.
    OpenUrlCrossRefPubMed
  29. 29.↵
    1. Lavie CJ,
    2. Milani RV
    (1994) Effects of cardiac rehabilitation and exercise training on low-density lipoprotein cholesterol in patients with hypertriglyceridemia and coronary artery disease. Am J Cardiol 74(12):1192–1195, pmid:7977088.
    OpenUrlCrossRefPubMed
  30. 30.↵
    1. Lavie CJ,
    2. Milani RV
    (1997) Effects of cardiac rehabilitation, exercise training, and weight reduction on exercise capacity, coronary risk factors, behavioral characteristics, and quality of life in obese coronary patients. Am J Cardiol 79(4):397–401, pmid:9052338.
    OpenUrlCrossRefPubMed
  31. 31.↵
    1. Lavie CJ,
    2. Milani RV
    (2004) Prevalence of anxiety in coronary patients with improvement following cardiac rehabilitation and exercise training. Am J Cardiol 93(3):336–339, pmid:14759385.
    OpenUrlCrossRefPubMed
  32. 32.↵
    1. Lavie CJ,
    2. Milani RV
    (2005) Prevalence of hostility in young coronary artery disease patients and effects of cardiac rehabilitation and exercise training. Mayo Clin Proc 80(3):335–342, pmid:15757014.
    OpenUrlCrossRefPubMed
  33. 33.↵
    1. Milani RV,
    2. Lavie CJ,
    3. Mehra M. R
    (2004) Reduction in C-reactive protein through cardiac rehabilitation and exercise training. J Am Coll Cardiol 43(6):1056–1061, pmid:15028366.
    OpenUrlFREE Full Text
  34. 34.↵
    1. Milani RV,
    2. Lavie CJ
    (2007) Impact of cardiac rehabilitation on depression and its associated mortality. Am J Med 120(9):799–806, pmid:17765050.
    OpenUrlCrossRefPubMed
  35. 35.↵
    1. Lavie CJ,
    2. Milani RV
    (2006) Adverse psychological and coronary risk profiles in young patients with coronary artery disease and benefits of formal cardiac rehabilitation. Arch Intern Med 166(17):1878–1883, pmid:17000945.
    OpenUrlCrossRefPubMed
  36. 36.↵
    1. Church TS,
    2. Lavie CJ,
    3. Milani RV,
    4. Kirby GS
    (2002) Improvements in blood rheology after cardiac rehabilitation and exercise training in patients with coronary heart disease. Am Heart J 143(2):349–355, pmid:11835042.
    OpenUrlCrossRefPubMed
  37. 37.↵
    1. Heyward VH
    (1998) Practical body composition assessment for children, adults, and older adults. Int J Sport Nutr 8(3):285–307, pmid:9738136.
    OpenUrlPubMed
  38. 38.↵
    1. Milani RV,
    2. Lavie CJ,
    3. Mehra MR
    (2004) Cardiopulmonary exercise testing: how do we differentiate the cause of dyspnea. Circulation 110(4):e27–e31, pmid:15277333.
    OpenUrlFREE Full Text
  39. 39.↵
    1. Milani RV,
    2. Lavie CJ,
    3. Mehra MR,
    4. Ventura HO
    (2006) Understanding the basics of cardiopulmonary exercise testing. Mayo Clin Proc 81(12):1603–1611, pmid:17165639.
    OpenUrlCrossRefPubMed
  40. 40.↵
    1. Kyle UG,
    2. Schutz Y,
    3. Dupertuis YM,
    4. Pichard C
    (2003) Body composition interpretation. Contributions of the fat-free mass index and the body fat mass index. Nutrition 19(7-8):597–604, pmid:12831945.
    OpenUrlCrossRefPubMed
  41. 41.↵
    1. Norgan NG
    (1994) Population differences in body composition in relation to the body mass index. Eur J Clin Nutr 48 Suppl 3:S10–S25; discussion S26-S27, pmid:7843146.
    OpenUrlPubMed
  42. 42.↵
    1. Meeuwsen S,
    2. Horgan GW,
    3. Elia M
    (2010) The relationship between BMI and percent body fat, measured by bioelectrical impedance, in a large adult sample is curvilinear and influenced by age and sex. Clin Nutr 29(5):560–566, pmid:20359792.
    OpenUrlCrossRefPubMed
  43. 43.↵
    1. Jackson AS,
    2. Stanforth PR,
    3. Gagnon J,
    4. et al.
    (2002) The effect of sex, age and race on estimating percentage body fat from body mass index: The Heritage Family Study. Int J Obes Relat Metab Disord 26(6):789–796, pmid:12037649.
    OpenUrlCrossRefPubMed
  44. 44.↵
    1. Gallagher D,
    2. Visser M,
    3. Sepúlveda D,
    4. Pierson RN,
    5. Harris T,
    6. Heymsfield SB
    (1996) How useful is body mass index for comparison of body fatness across age, sex, and ethnic groups. Am J Epidemiol 143(3):228–239, pmid:8561156.
    OpenUrlCrossRefPubMed
  45. 45.↵
    1. Movsesyan L,
    2. Tankó LB,
    3. Larsen PJ,
    4. Christiansen C,
    5. Svendsen OL
    (2003) Variations in percentage of body fat within different BMI groups in young, middle-aged and old women. Clin Physiol Funct Imaging 23(3):130–133, pmid:12752553.
    OpenUrlCrossRefPubMed
  46. 46.↵
    1. Deurenberg P,
    2. Deurenberg-Yap M
    (2001) Differences in body-composition assumptions across ethnic groups: practical consequences. Curr Opin Clin Nutr Metab Care 4(5):377–383, pmid:11568498.
    OpenUrlCrossRefPubMed
  47. 47.↵
    1. Gurrici S,
    2. Hartriyanti Y,
    3. Hautvast JG,
    4. Deurenberg P
    (1998) Relationship between body fat and body mass index: differences between Indonesians and Dutch Caucasians. Eur J Clin Nutr 52(11):779–783, pmid:9846588.
    OpenUrlCrossRefPubMed
  48. 48.↵
    1. Deurenberg P,
    2. Andreoli A,
    3. Borg P,
    4. et al.
    (2001) The validity of predicted body fat percentage from body mass index and from impedance in samples of five European populations. Eur J Clin Nutr 55(11):973–979, pmid:11641746.
    OpenUrlCrossRefPubMed
  49. 49.↵
    1. Amani R
    (2007) Comparison between bioelectrical impedance analysis and body mass index methods in determination of obesity prevalence in Ahvazi women. Eur J Clin Nutr 61(4):478–482, pmid:17063145.
    OpenUrlPubMed
  50. 50.↵
    1. Bozkirli E,
    2. Ertorer ME,
    3. Bakiner O,
    4. Tutuncu NB,
    5. Demirag NG
    (2007) The validity of the World Health Organisation's obesity body mass index criteria in a Turkish population: a hospital-based study. Asia Pac J Clin Nutr 16(3):443–447, pmid:17704025.
    OpenUrlPubMed
  51. 51.↵
    1. Gaskin PS,
    2. Walker SP
    (2003) Obesity in a cohort of black Jamaican children as estimated by BMI and other indices of adiposity. Eur J Clin Nutr 57(3):420–426, pmid:12627178.
    OpenUrlCrossRefPubMed
  52. 52.↵
    1. Kagawa M,
    2. Kerr D,
    3. Uchida H,
    4. Binns CW
    (2006) Differences in the relationship between BMI and percentage body fat between Japanese and Australian-Caucasian young men. Br J Nutr 95(5):1002–1027, pmid:16611393.
    OpenUrlCrossRefPubMed
  53. 53.↵
    1. Sampei MA,
    2. Novo NF,
    3. Juliano Y,
    4. Sigulem DM
    (2001) Comparison of the body mass index to other methods of body fat evaluation in ethnic Japanese and Caucasian adolescent girls. Int J Obes Relat Metab Disord 25(3):400–408, pmid:11319639.
    OpenUrlPubMed
  54. 54.↵
    1. WHO Expert Consultation
    (2004) Appropriate body-mass index for Asian populations and its implications for policy and intervention strategies. Lancet 363(9403):157–163, pmid:14726171, Erratum in: Lancet. 2004;363(9412):902.
    OpenUrlCrossRefPubMed
  55. 55.↵
    1. Deurenberg-Yap M,
    2. Chew SK,
    3. Deurenberg P
    (2002) Elevated body fat percentage and cardiovascular risks at low body mass index levels among Singaporean Chinese, Malays and Indians. Obes Rev 3(3):209–215, pmid:12164474.
    OpenUrlCrossRefPubMed
  56. 56.↵
    1. Walker SP,
    2. Rimm EB,
    3. Ascherio A,
    4. Kawachi I,
    5. Stampfer MJ,
    6. Willett WC
    (1996) Body size and fat distribution as predictors of stroke among US men. Am J Epidemiol 144(12):1143–1150, pmid:8956626.
    OpenUrlCrossRefPubMed
  57. 57.↵
    1. Tsai CJ,
    2. Leitzmann MF,
    3. Willett WC,
    4. Giovannucci EL
    (2004) Prospective study of abdominal adiposity and gallstone disease in US men. Am J Clin Nutr 80(1):38–44, pmid:15213025.
    OpenUrlAbstract/FREE Full Text
  58. 58.↵
    1. Duren DL,
    2. Sherwood RJ,
    3. Czerwinski SA,
    4. et al.
    (2008) Body composition methods: comparisons and interpretation. J Diabetes Sci Technol 2(6):1139–1146, pmid:19885303.
    OpenUrlCrossRefPubMed
  59. 59.↵
    1. Tataranni PA,
    2. Ravussin E
    (1995) Use of dual-energy X-ray absorptiometry in obese individuals. Am J Clin Nutr 62(4):730–734, pmid:7572700.
    OpenUrlAbstract/FREE Full Text
  60. 60.↵
    1. Fields DA,
    2. Hunter GR
    (2004) Monitoring body fat in the elderly: application of air-displacement plethysmography. Curr Opin Clin Nutr Metab Care 7(1):11–14, pmid:15090897.
    OpenUrlPubMed
  61. 61.↵
    1. Piers LS,
    2. Soares MJ,
    3. Frandsen SL,
    4. O'Dea K
    (2000) Indirect estimates of body composition are useful for groups but unreliable in individuals. Int J Obes Relat Metab Disord 24(9):1145–1152, pmid:11033983.
    OpenUrlCrossRefPubMed
  62. 62.↵
    1. Nuñez C,
    2. Kovera AJ,
    3. Pietrobelli A,
    4. et al.
    (1999) Body composition in children and adults by air displacement plethysmography. Eur J Clin Nutr 53(5):382–387, pmid:10369494.
    OpenUrlCrossRefPubMed
  63. 63.↵
    1. Jackson AS,
    2. Pollock ML,
    3. Graves JE,
    4. Mahar MT
    (1988) Reliability and validity of bioelectrical impedance in determining body composition. J Appl Physiol 64(2):529–534, pmid:3372410.
    OpenUrlPubMed
  64. 64.↵
    1. Mullie P,
    2. Vansant G,
    3. Hulens M,
    4. Clarys P,
    5. Degrave E
    (2008) Evaluation of body fat estimated from body mass index and impedance in Belgian male military candidates: comparing two methods for estimating body composition. Mil Med 173(3):266–270, pmid:18419029.
    OpenUrlPubMed
  65. 65.↵
    1. Carrasco F,
    2. Reyes E,
    3. Rimler O,
    4. Rios F
    (2004) [Predictive accuracy of body mass index in estimating body fatness measured by bioelectrical impedance]. Arch Latinoam Nutr 54(3):280–286, pmid:15807202, Spanish.
    OpenUrlPubMed
  66. 66.↵
    1. Claros G,
    2. Hull HR,
    3. Fields DA
    (2005) Comparison of air displacement plethysmography to hydrostatic weighing for estimating total body density in children. BMC Pediatr 5:37, pmid:16153297.
    OpenUrlPubMed
  67. 67.↵
    1. Demura S,
    2. Sato S,
    3. Kitabayashi T
    (2006) Estimation of body density based on hydrostatic weighing without head submersion in young Japanese adults. J Sports Sci 24(6):589–596, pmid:16608771.
    OpenUrlPubMed
  68. 68.↵
    1. Deurenberg P,
    2. Yap M,
    3. van Staveren WA
    (1998) Body mass index and percent body fat: a meta analysis among different ethnic groups. Int J Obes Relat Metab Disord 22(12):1164–1171, pmid:9877251.
    OpenUrlCrossRefPubMed
  69. 69.↵
    1. Jackson AS,
    2. Pollock ML,
    3. Ward A
    (1980) Generalized equations for predicting body density of women. Med Sci Sports Exerc 12(3):175–181, pmid:7402053.
    OpenUrlPubMed
  70. 70.↵
    1. Deurenberg P,
    2. van der Kooy K,
    3. Leenen R,
    4. Weststrate JA,
    5. Seidell JC
    (1991) Sex and age specific prediction formulas for estimating body composition from bioelectrical impedance: a cross-validation study. Int J Obes 15(1):17–25, pmid:2010255.
    OpenUrlPubMed
PreviousNext
Back to top

In this issue

Ochsner Journal
Vol. 11, Issue 3
Sep 2011
  • Table of Contents
  • Index by author
Print
Download PDF
Email Article

Thank you for your interest in spreading the word on Ochsner Journal.

NOTE: We only request your email address so that the person you are recommending the page to knows that you wanted them to see it, and that it is not junk mail. We do not capture any email address.

Enter multiple addresses on separate lines or separate them with commas.
Body Composition in Coronary Heart Disease: How Does Body Mass Index Correlate With Body Fatness?
(Your Name) has sent you a message from Ochsner Journal
(Your Name) thought you would like to see the Ochsner Journal web site.
CAPTCHA
This question is for testing whether or not you are a human visitor and to prevent automated spam submissions.
Citation Tools
Body Composition in Coronary Heart Disease: How Does Body Mass Index Correlate With Body Fatness?
Alban De Schutter, Carl J. Lavie, Jose Gonzalez, Richard V. Milani
Ochsner Journal Sep 2011, 11 (3) 220-225;

Citation Manager Formats

  • BibTeX
  • Bookends
  • EasyBib
  • EndNote (tagged)
  • EndNote 8 (xml)
  • Medlars
  • Mendeley
  • Papers
  • RefWorks Tagged
  • Ref Manager
  • RIS
  • Zotero
Share
Body Composition in Coronary Heart Disease: How Does Body Mass Index Correlate With Body Fatness?
Alban De Schutter, Carl J. Lavie, Jose Gonzalez, Richard V. Milani
Ochsner Journal Sep 2011, 11 (3) 220-225;
del.icio.us logo Twitter logo Facebook logo Mendeley logo
  • Tweet Widget
  • Facebook Like
  • Google Plus One

Jump to section

  • Article
    • Abstract
    • INTRODUCTION
    • METHODS
    • RESULTS
    • DISCUSSION
    • CONCLUSIONS
    • REFERENCES
  • Figures & Data
  • References
  • Info & Metrics
  • PDF

Cited By...

  • No citing articles found.
  • Google Scholar

More in this TOC Section

  • 3D-Printed Patient-Specific Models of the Aortic Arch for Advanced Visualization of Complex Neurointerventional Cases
  • Accuracy of Perfusion Index and Perfusion Index Ratio as a Predictor of a Successful Low Interscalene Brachial Plexus Block: A Prospective Observational Study
  • HEART Score Agreement Between Attending and Resident Emergency Medicine Physicians for Patients With Potential Acute Coronary Syndrome
Show more ORIGINAL RESEARCH

Similar Articles

Keywords

  • Aging
  • body composition
  • Coronary heart disease
  • fat
  • sex
  • obesity
  • rehabilitation

Ochsner Journal Blog

Current Post

Be Careful Where You Publish

Our Content

  • Home
  • Current Issue
  • Ahead of Print
  • Archive
  • Featured Contributors
  • Ochsner Journal Blog
  • Archive at PubMed Central

Information & Forms

  • Instructions for Authors
  • Instructions for Reviewers
  • Submission Checklist
  • FAQ
  • License for Publishing-Author Attestation
  • Patient Consent Form
  • Submit a Manuscript

Services & Contacts

  • Permissions
  • Sign up for our electronic table of contents
  • Feedback Form
  • Contact Us

About Us

  • Editorial Board
  • About the Ochsner Journal
  • Ochsner Health
  • University of Queensland-Ochsner Clinical School
  • Alliance of Independent Academic Medical Centers

© 2025 Ochsner Clinic Foundation

Powered by HighWire