
Abstract
Background: Heart disease is a major cause of death in industrialized nations, with approximately 50% of these deaths attributable to sudden cardiac arrest. If patients at high risk for sudden cardiac arrest can be identified, their odds of surviving fatal arrhythmias can be significantly improved through prophylactic implantable cardioverter defibrillator placement. This review summarizes the current knowledge pertaining to surface electrocardiogram (ECG) predictors of sudden cardiac arrest.
Methods: We conducted a literature review focused on methods of predicting sudden cardiac arrest through noninvasive electrocardiographic testing.
Results: Several electrocardiographic-based methods of risk stratification of sudden cardiac arrest have been studied, including QT prolongation, QRS duration, fragmented QRS complexes, early repolarization, Holter monitoring, heart rate variability, heart rate turbulence, signal-averaged ECG, T wave alternans, and T-peak to T-end. These ECG findings have shown variable effectiveness as screening tools.
Conclusion: At this time, no individual ECG finding has been found to be able to adequately stratify patients with regard to risk for sudden cardiac arrest. However, one or more of these candidate surface ECG parameters may become useful components of future multifactorial risk stratification calculators.
- Arrhythmias–cardiac
- death–sudden–cardiac
- defibrillators–implantable
- electrocardiography
- primary prevention
- ventricular fibrillation
INTRODUCTION
Heart disease is a major cause of death in industrialized nations.1 Sudden cardiac arrest (SCA) accounts for approximately 50% of these deaths, amounting to 350,000-400,000 per year and making SCA second only to all cancers combined in terms of the number of American lives lost.2,3 SCA deaths are most often attributed to ventricular fibrillation (VF).2
Through large multicenter randomized controlled trials such as the Sudden Cardiac Death in Heart Failure Trial (SCD-HeFT) and the Multicenter Automatic Defibrillator Implantation Trial II (MADIT-II), it is well known that placement of an implantable cardioverter defibrillator (ICD) for the purpose of primary prevention of SCA results in a significant reduction in mortality in patients with a reduced left ventricular ejection fraction (LVEF).4,5 However, LVEF alone is neither sensitive enough nor specific enough a risk stratifier for SCA6: only a minority of patients implanted with these devices receive appropriate ICD therapies, and the majority of victims of SCA have no prior known cardiac disease.7 It is important to consider closely the risk/benefit relationship of ICD implantation, as patients with ICDs sometimes receive inappropriate therapies that have been associated with increased mortality.8 In addition to this adverse effect, patients receiving these devices are at risk for additional short- and long-term complications, including bleeding, pneumothorax, and device-related infection.9,10
ICDs are effective at aborting sudden cardiac death (SCD) resulting from ventricular tachyarrhythmia (VT).11 Considering the significant benefit of ICD therapy, an improved risk stratification method is needed to enable clinicians to better identify the patients who are most likely to benefit from these devices. The optimal risk stratification tool would be noninvasive, cost effective, expeditious, widely accessible, and effectively predictive. Because they may meet these criteria, the surface electrocardiogram (ECG) and ECG-related assessment techniques are being evaluated to determine if they can be used to identify patients at high risk for SCA. The surface ECG was first developed in 1902, using a string galvanometer to record the electrical potential difference between the extremities.12 It has become an essential tool for the initial evaluation of patients with cardiac complaints, specifically for identifying arrhythmias and ischemic heart disease.13 The ECG is an especially attractive screening tool because of its low cost and noninvasive application. We review the current knowledge base regarding the potential of surface ECG-based screening tools to predict SCA.
VENTRICULAR FIBRILLATION AND VENTRICULAR TACHYCARDIA IN SUDDEN CARDIAC ARREST
As mentioned above, SCA is most commonly caused by ventricular arrhythmias, particularly sustained monomorphic ventricular tachycardia and VF.2 Monomorphic ventricular tachycardia is often supported by a scar-based reentry circuit that can be triggered by a poorly timed premature ventricular contraction, variations in cardiac cycle length, and variations in heart rate.14 Considering this mechanism, ICD therapy (antitachycardia pacing and/or high-voltage shock) is effective in controlling this arrhythmia, and with pharmacologic control of triggers and catheter ablation, the freedom from future events can be lasting.15 In contrast, VF is thought to be caused by multiple rotors throughout the heart and is commonly caused by ischemia or primary VF syndromes.16 In this setting, ICD discharge can abort SCA acutely, but without control of causative factors (eg, ischemia), VF may recur.17
QT PROLONGATION
One of the most well-known ECG parameters potentially identifying SCA risk is QT prolongation. The surface ECG QT interval represents the duration of ventricular depolarization and repolarization. Slower ventricular repolarization manifests as QT prolongation and indicates an increase in the temporal dispersion of various ventricular regions' refractory periods.18 As the QT prolongs, the vulnerable period for arrhythmia induction also prolongs, resulting in increased susceptibility to ventricular tachyarrhythmias.19 Prolonged QT intervals found in congenital, acquired, and drug-induced conditions have been related to the development of complex and sometimes fatal arrhythmias—most often, the rhythm torsade de pointes.20
Studies of QT prolongation and its association with SCD have come to varying conclusions. For example, a study of 457 post–myocardial infarction (MI) patients showed no consistent relationship between QT interval and mortality.21 Subsequently, another study of 280 infarct survivors again showed that QT dispersion was unable to independently predict ventricular tachycardia, VF, and death.22 In contrast, a study comparing 17 patients who died of cardiac arrhythmia to 51 matched survivors of VT showed mean QRS duration and mean QT to be independent contributors to the risk of arrhythmia and ultimately to cardiac death.23 On the whole, the evidence is mixed regarding QT prolongation as an independent ECG predictor of SCA. It may be useful in some populations, but not in others.
QRS DURATION
The ECG QRS complex represents ventricular depolarization. QRS duration has been shown consistently to be associated with increased all-cause mortality,24,25 but the literature reports mixed results with regard to SCA specifically related to arrhythmia. In specific patient populations—for example, in the setting of aggressive antihypertensive therapy—prolonged QRS duration was directly correlated with the risk of SCD, independent of many other known risk factors.26 In contrast, the Multicenter UnSustained Tachycardia Trial (MUSTT) of patients with ischemic cardiomyopathy, nonsustained ventricular tachycardia, and LVEF ≤40% showed that despite the relationship between overall mortality and the wide QRS patterns of left bundle branch block and nonspecific intraventricular conduction delay, no significant association was seen between wide QRS patterns and inducibility of ventricular tachycardia with programmed ventricular stimulation.27 In addition, the Pacing Fast Ventricular Tachycardia Reduces Shock Therapies (PainFREE Rx II) trial of ICD recipients found that QRS duration had no utility for predicting appropriate ICD therapies for VT.28
FRAGMENTED QRS COMPLEXES
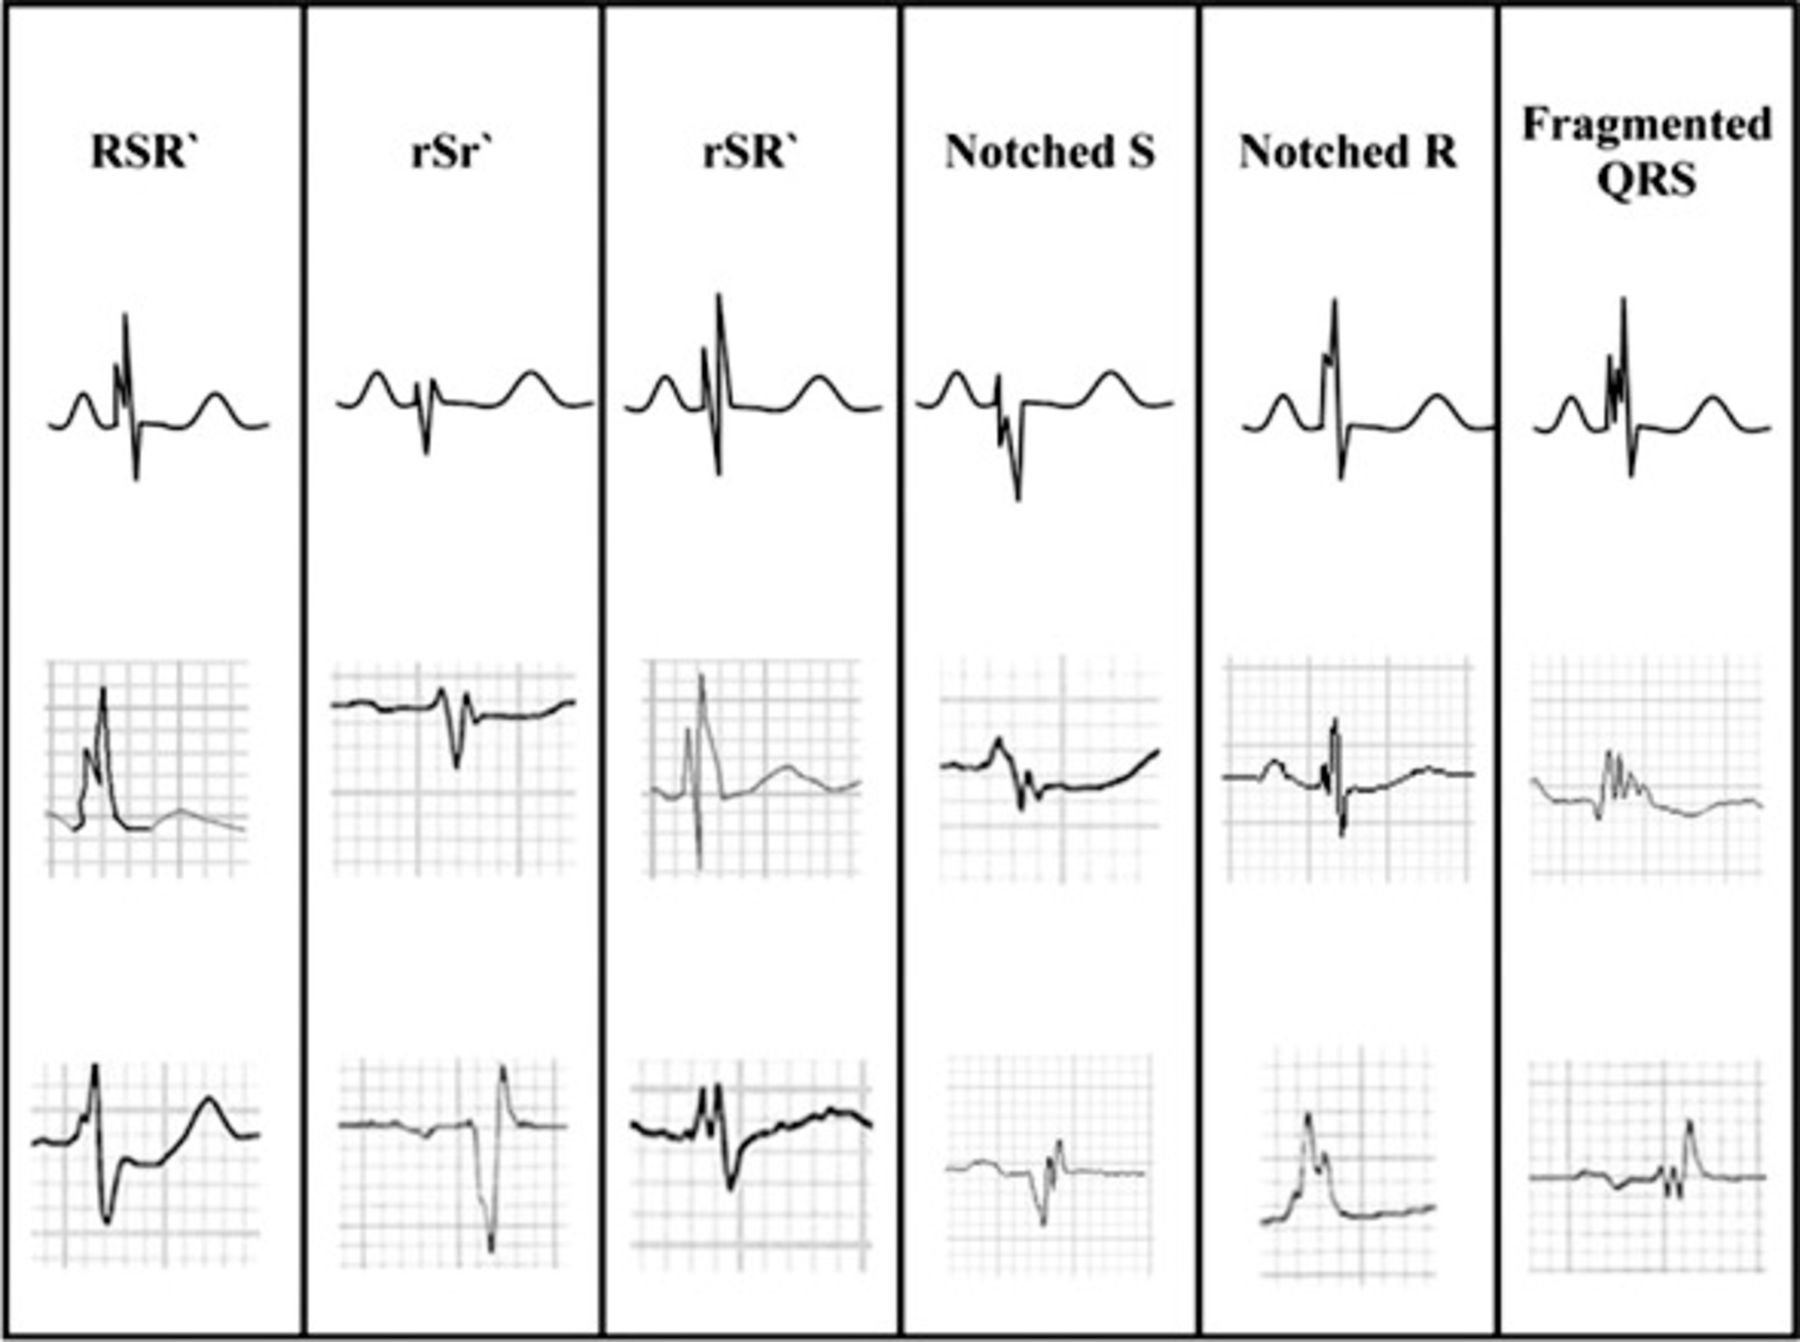
Fragmented QRS complexes (fQRS) are thought to represent conduction disarray caused by ventricular myocardial fibrosis and/or scarring.29 As shown in Figure 1, the fQRS may have multiple multicomponent morphological patterns, with QRS duration able to be greater than or less than the normal cutoff of 120 ms.30 Das et al described fQRS complexes as a marker of abnormal ventricular depolarization and a predictor of mortality and SCD.30 Subsequently, Strauss et al published a system of QRS scoring correlated with the presence of ventricular myocardial scar on cardiac magnetic resonance imaging in patients with either ischemic or nonischemic cardiomyopathy.31 This scoring scheme involved measurements of amplitude, duration, and notching of the Q, R, and S waves in 10 of 12 standard ECG leads (excluding leads III and aVR). An examination of 797 patients from the ICD arm of SCD-HeFT demonstrated that a higher fQRS score correlated with a higher incidence of subsequent ventricular arrhythmia.32 Based on these limited findings, the presence and severity of QRS fragmentation may be a promising tool to assist in identification of patients at highest risk for SCD but likely will not be powerful enough to independently risk stratify patients regarding SCA.

Different morphologies of the fragmented QRS. (From Das et al30 and reprinted with permission of Elsevier and the Heart Rhythm Society.)
EARLY REPOLARIZATION
The early repolarization (ER) pattern on surface ECG classically has been considered a normal variant, but the literature has described a potential role for this finding as a prognosticator of risk for ventricular arrhythmia. ER is defined as elevation of the J point (ie, the junction of the QRS complex and ST-segment) by 0.1 mV in 2 contiguous inferior or lateral ECG leads.33 Studies have shown an increased incidence of early repolarization in patients with idiopathic VF compared to control subjects (31% vs 5%, P<0.001).34 In addition, during follow-up, patients with ER in that population were found to have a higher incidence of recurrent episodes of VF. Importantly, the ER pattern may have an inherited component: Nunn et al found that first-degree relatives of patients who died from SCA were more likely to display findings of J point elevation on surface ECG compared to control subjects.35 Mutations noted in L-type calcium channel subunits are currently being investigated as potentially causative of this malignant phenotype.35 Whether early repolarization can be used to reliably predict SCD remains to be seen, but its ease of detection makes it an appealing target for future studies.
HOLTER MONITORING
The Holter monitor consists of a 2- or 3-lead ambulatory ECG that records the heart rate and rhythm, typically for a period of 24-48 hours. Basic parameters commonly assessed through Holter monitoring include heart rhythm(s), frequency of ectopy (ie, premature atrial or ventricular contractions), average heart rate, and heart rate range over time.
Previous studies have demonstrated an association between Holter-detected episodes of nonsustained ventricular tachycardia and/or significant premature ventricular contraction burden and subsequent significant arrhythmic events and mortality.36,37 In 2005, Mäkikallio et al demonstrated in a post-MI population that nonsustained ventricular tachycardia was an independent predictor of SCD, even after adjustment for age, diabetes, and LVEF.38
In a study of patients with or without known cardiac disease, data from 867 subjects who underwent 24-hour Holter monitoring were reviewed, and a high resting heart rate was found to be independently associated with ventricular arrhythmia, even after controlling for LVEF.39 In fact, a metaanalysis published in 2016 showed that high resting heart rate is an independent predictor not only of cardiovascular mortality but also of all-cause mortality in the general population.40
HEART RATE VARIABILITY
Healthy individuals demonstrate considerable heart rate variability over time. Heart rate variability has been shown to be an index of parasympathetic function, and lower heart rate variability has been linked to an increased risk for ventricular arrhythmia and mortality.41,42 For example, in a post-MI population, patients with low heart rate variability, as indicated by a standard deviation of all normal RR intervals (SDNN) of <50 ms, had a significantly higher risk of 1-year mortality compared to patients with an SDNN >50 ms (34% vs 9%, P<0.0001), independent of LVEF.43 As promising as these data appear, heart rate variability is influenced by numerous factors including age, sex, and medications, thus making it difficult to compare across broad patient populations. In support of this notion, a review from Murukesan et al in 2013 concluded that heart rate variability must be combined with other ECG markers (eg, T wave alternans and heart rate turbulence) to achieve substantial prognostic value.44 In addition, there are technical limitations; for example, heart rate variability cannot be evaluated in patients with active atrial fibrillation or frequent ectopy.45
HEART RATE TURBULENCE
Heart rate turbulence is defined by minute changes in ventricular cycle length following premature ventricular contractions. After a premature ventricular contraction, the normal response is a brief initial increase in heart rate, followed by a return to baseline. These changes are the result of premature ventricular contraction–induced hemodynamic disturbances, and the speed at which they happen ultimately provides information regarding cardiovascular autonomic function. Heart rate turbulence is qualified by 2 parameters: turbulence onset and turbulence slope. Turbulence onset is the relative change in the RR interval caused by a premature ventricular contraction, and turbulence slope is the rate of change of the RR interval back to baseline.46 Heart rate turbulence can also be induced through the use of intracardiac pacing performed in the electrophysiology laboratory or through an implanted pacemaker or an ICD.47 One contemporary protocol for measuring induced heart rate turbulence involves computing turbulence slope and turbulence onset following 10 ventricular extrastimuli with a coupling interval of 60%-70% of the sinus cycle length.47
With regard to SCA prediction, heart rate turbulence has been most extensively studied in the post-MI population and has been shown to be a strong independent predictor of SCA risk.38,48 For example, the REFINE (Risk Estimation Following Infarction Noninvasive Evaluation) study of patients with LVEF <50% showed that heart rate turbulence can be helpful for identifying such patients at high risk for cardiac arrest.49 Another study involving 2,343 patients with preserved LVEF in the post-MI period showed that severe autonomic failure (ie, decreased heart rate turbulence in combination with poor heart rate deceleration capacity) identifies a high-risk group equivalent in number and mortality risk to the population of post-MI patients with LVEF <30%.50 In opposition to this finding, a retrospective analysis of 884 patients from the MADIT-II trial of post-MI patients with LVEF ≤30% showed that heart rate turbulence parameters were not independently predictive of arrhythmia or SCA.51 However, this study was limited by a short recording period that may not have provided an adequate representation of average heart rate turbulence.
Of the information obtained from Holter monitoring, heart rate turbulence may be the most promising parameter for prediction of SCD but likely as part of a multifactor scoring system. Heart rate turbulence is limited by the fact that it has primarily been studied in the post-MI population, so generalization to other populations is not advised at present. In addition, heart rate turbulence is affected by several potential confounding variables such as age, medications, left ventricle function, and cardiac perfusion status.46 Furthermore, the need for an extended recording may decrease its attractiveness for routine use. In the future, a target for research may be the use of shorter recording periods, as well as expanded use of paced ventricular extrasystoles to simulate passive heart rate turbulence recordings.
SIGNAL-AVERAGED ELECTROCARDIOGRAM
The signal-averaged ECG (SAECG) is an amplified and processed ECG that can detect abnormal microvolt-level potentials not visible on a standard surface ECG. These microvolt potentials are known as late potentials because they occur during the terminal portion of the processed QRS complex. Late potentials arise from areas of slow conduction, indicating delayed depolarization of diseased myocardium that could indicate risk for reentrant ventricular arrhythmias. The presence of late potentials has been demonstrated to predict the inducibility of ventricular tachycardia at invasive electrophysiology study.52 In addition, a study analyzing a subset of the MUSTT found that the criteria of reduced ejection fraction combined with abnormal SAECG may have utility in identifying patients at particularly high risk for SCD.53 In contrast, however, the Coronary Artery Bypass Graft (CABG) Patch Trial in patients with coronary artery disease, depressed LVEF, and abnormal SAECG found no evidence of improved survival in patients who received ICD placement compared to patients who did not receive an ICD.54
Several studies have examined the utility of SAECG in the post-MI period, showing no significant difference in survival between patients with a positive SAECG and a negative SAECG.55,56 The negative predictive value of SAECG was noted to be high (>95%), but its positive predictive value was much lower (20%), therefore making it minimally useful for detecting patients at risk for SCA.57 The utility of SAECG has been questioned further in the post–percutaneous coronary intervention (PCI) era. In a series of 968 post-MI patients (91% of whom received PCI), Bauer et al demonstrated that the presence of late potentials had no significant association with arrhythmia or cardiac death during 34 months of follow-up.58
The acquisition of SAECG recordings can be technically challenging. Because the late potentials that define a positive SAECG are typically of low amplitude, particular attention to skin preparation prior to electrode placement is necessary to reduce signal noise. Electronic filters can further reduce signal noise by evening out baseline drift and by filtering out high-frequency signals such as skeletal muscle potentials. SAECG is then performed by collecting an extended period of ECG recording (often 5-20 minutes) and then averaging the QRS complexes to reduce the signal-to-noise ratio, revealing low-amplitude signals that otherwise are invisible.59 Most commonly, signals are averaged through the temporal technique that uses an automated computer algorithm to reduce random noise by averaging the QRS complexes over time.59 This technique has 3 distinct requirements. First, the ECG signal must be repetitive and without variation. Second, the entire signal needs to be referenced to a single point on the ECG. Third, the signal of interest and the noise must be independent and remain independent.59 Because of these requirements, variability in the signal (eg, premature beats, irregular rhythms, variable bundle branch block) would make the averaging and noise filtration inaccurate.59
With a high negative predictive value, low positive predictive value, and technical challenges, SAECG may provide some valuable information but at present is not a useful tool for routine screening for patients at risk for SCD. Rather, a positive SAECG is most often used today as one of the minor diagnostic criteria for the fairly rare inherited disorder arrhythmogenic right ventricular cardiomyopathy.60,61
T WAVE ALTERNANS
The T wave represents ventricular repolarization. T wave alternans (TWA) is beat-to-beat fluctuation in the amplitude of the T wave as shown in Figure 2. TWA may be detected in all patients at high heart rates, but it is abnormal when significant TWA exists at relatively slow heart rates (ie, <110 bpm).62 Abnormal TWA is associated with increased dispersion of repolarization of the left ventricle and therefore has been studied for its value in predicting SCD. TWA can be assessed during exercise, atrial pacing, or ambulatory Holter monitoring.63,64

T wave alternans (TWA) of increasing subtlety. A. Gross alternans of elevated ST/T-segments in a patient with angina pectoris preceding ventricular tachycardia (VT). B. Visible alternans of T wave polarity in a woman without angina, heralding polymorphic VT. C. Subtle but visible TWA after tachycardia termination, without arterial pressure alternans (bottom). D. Visually inapparent microvolt-level TWA, uncovered by digital signal processing. *=The more positive T wave of each alternating pair. (From Narayan64 and reprinted with permission of Elsevier and the American College of Cardiology.)
As with many other ECG-based proposed risk stratification tools, studies of TWA have shown varying results. A study of a Holter-monitored subset of the Cardiovascular Health Study population demonstrated that increased amplitude of TWA was associated with SCD.65 In addition, a prospective study of 1,003 patients with coronary artery disease with a wide range of LVEFs demonstrated that assessment of TWA through ambulatory Holter monitoring could be valuable as an independent predictor of risk for SCD.66 Similarly, following MI, microvolt TWA was demonstrated to be a strong predictor of serious arrhythmias and SCD, regardless of left ventricle function.67-69 However, Chow et al found that microvolt TWA was unable to reliably predict ventricular arrhythmias in a post-ICD population with LVEF ≤30%, although microvolt TWA had a significant negative predictive value with regard to overall mortality.70 Supporting this finding, the Alternans Before Cardioverter Defibrillator (ABCD) trial concluded that the true value of microvolt TWA lies in identifying patients who are least likely to benefit from ICD placement.71
The use of TWA was further tailored by the Cornell group who demonstrated that neither TWA nor invasive electrophysiology study offered any negative predictive value in patients with a wide QRS complex (>120 ms).72 Thus, the use of TWA as a risk stratifier seems to have a significant additional limitation: patients can only be deemed truly low risk if they have both a negative TWA test and a narrow QRS. In summary, TWA could be useful in reclassifying patients who otherwise might be considered at high risk for SCA (eg, those with reduced LVEF) as actually being at lower risk, but it is less likely to be valuable as a tool for detecting high risk in otherwise low-risk patients.
T-PEAK TO T-END
The interval from the peak of the T wave to the end of the T wave on the surface ECG (T-peak to T-end, or Tpe) has been shown to be a measure of dispersion of ventricular repolarization (DVR).73-75 Prolongation of this interval signifies greater DVR and therefore increased susceptibility to reentrant VT.76,77
Longer Tpe has been shown to predict VT, sudden death, or both in many populations with diverse characteristics.78 Nearly every published trial has shown longer Tpe to be associated with higher risk. For example, in 2007, prolonged Tpe was shown to be associated with increased mortality in patients with congenital and acquired long QT syndrome,79 and similar findings were reported in 2009 in patients undergoing primary PCI for MI.80 The relationship of Tpe interval with VT also has been described extensively in patients with Brugada syndrome. In 2006, 29 subjects with confirmed Brugada syndrome were studied, together with a similar number of age- and sex-matched controls. A significant positive correlation was found between lengthened Tpe intervals and subsequent serious arrhythmic events.81 Another study of 23 individuals with Brugada syndrome correlated Tpe intervals with inducibility of VT/VF at programmed stimulation: there was a direct relationship between lengthened Tpe interval and inducibility of VT and VF.82 Of course, by virtue of their low numbers of subjects, both of these studies were limited by low power. However, these early findings made Tpe an appealing subject for researchers investigating ECG predictors of SCD.
In 2011, Panikkath et al described the relationship between Tpe and SCD.83 Using ECGs in sinus rhythm, this group compared the Tpe intervals of 353 patients who had experienced SCD to the Tpe intervals of a matched control group of 342 patients. They found that Tpe had a significant association with SCD, even after adjusting for age, sex, QTc, QRS duration, and left ventricle function. In 2012, the Ochsner group investigated the relationship of rate-corrected Tpe (Tpec) to VT and/or death in patients with left ventricle dysfunction and an ICD. The study showed that after a mean follow-up of 30 months, a longer Tpec correlated with a higher incidence of appropriate ICD therapy and/or death, even after correcting for other univariable predictors.84
Considering the convincing relationship between the Tpec interval and the occurrence of VT and SCD in a variety of populations,80-83,85-88 the Ochsner cardiac electrophysiology group further examined Tpe in a population with the most common indication for primary prevention ICD placement: systolic cardiomyopathy without a prior history of VT. In this investigation, published in 2015, the authors studied 305 patients with LVEF ≤35% who had undergone ICD placement for primary prevention. The results are depicted in Figure 3. Even after controlling for a variety of univariable predictors, the data showed that the Tpec interval was independently predictive of VT, all-cause mortality, and the combined endpoint of VT/VF or death.78
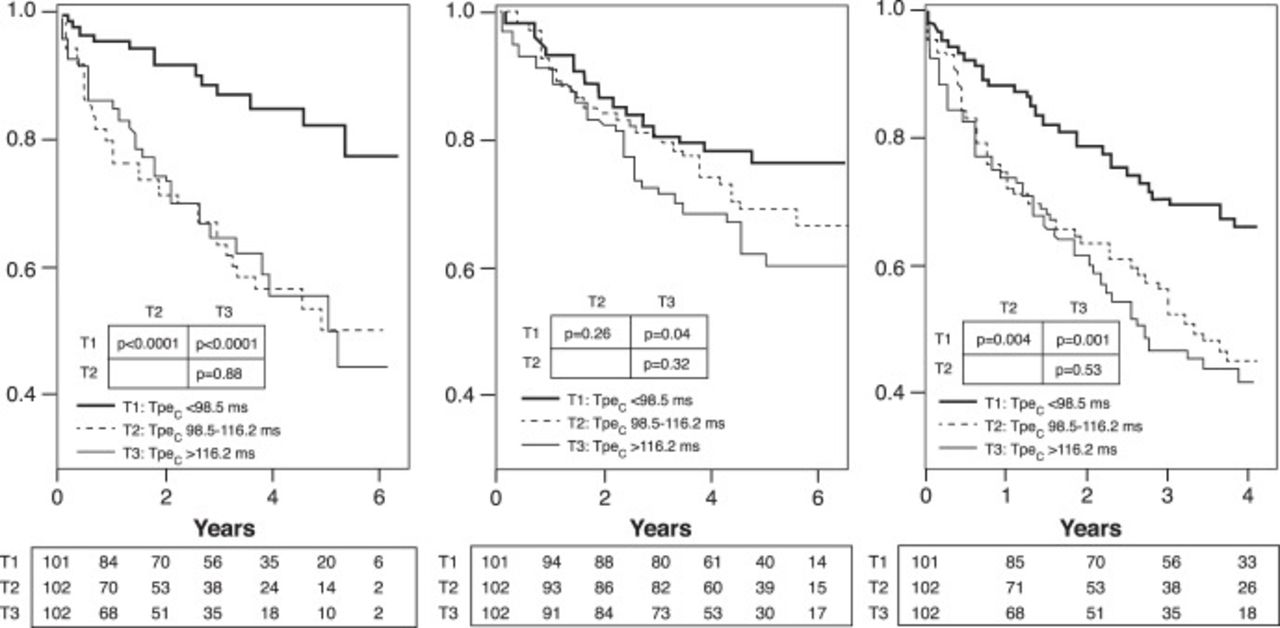
The utility of the T-peak to T-end (Tpe) interval for the prediction of ventricular tachyarrhythmia and death. A. Kaplan-Meier plots of freedom from appropriate implantable cardioverter-defibrillator therapy, stratified by tertiles (T1, T2, T3) of corrected Tpe (Tpec). B. Kaplan-Meier plots of all-cause mortality, stratified by tertiles of Tpec. C. Kaplan-Meier plots of arrhythmia-free survival, stratified by tertiles of Tpec. (From Rosenthal et al78 and reprinted with permission of Elsevier and the Heart Rhythm Society.)
In ongoing research, the Ochsner group is continuing to refine the use of Tpe through examination of the optimal measurement method for this interval, as well as the optimal method for heart rate correction. These studies, thus far published only in abstract form, have shown that the predictive ability of Tpe can vary depending on the method used to measure this interval and that prediction is enhanced by correction for heart rate.89 Further, among heart rate correction formulas, the Framingham and Hodges methods appear to improve prediction more than the methods of Bazett and Fridericia.90
Once the use of Tpe is standardized, it may become valuable as a part of future multicomponent risk prediction algorithms.
INHERITED SUDDEN DEATH SYNDROMES
Ion channels located in the cardiac cellular membrane are responsible for the cardiac action potential. When a genetic mutation results in abnormal functioning of these channels, a patient can be at risk for life-threatening arrhythmias.91 Considering that these abnormalities affect conduction, some can be detected on the resting ECG, such as the Brugada, long QT (LQT), and short QT (SQT) syndromes.
Brugada syndrome is an autosomal dominant sudden death syndrome related to mutations affecting the sodium channel that accounts for 4%-12% of cases of SCD.92 It is represented on the ECG as coved ST-segment elevation in the anterior precordial leads, although some variation in morphology does occur and the pattern can be variably present over time, even in the same individual.93 When Brugada syndrome manifests, it is usually as VT in young adults, but such events have also been described in children.92 These events can occur during sleep or rest and especially during times of fever, as some Brugada-causing mutations are thought to affect the Na+ channel in a temperature-dependent manner.93 Males have a higher frequency of arrhythmic events because of a sex-specific effect on gene expression.94
LQT syndrome is the most common channelopathy, estimated to occur in approximately 1 in 2,500 people, putting them at risk for torsade de pointes and SCD.92 LQT syndrome was first classified as the autosomal dominant Romano-Ward syndrome and the autosomal recessive Jervell and Lange-Nielsen syndrome that is associated with bilateral sensorineural deafness.95 The various subtypes of LQT syndrome are encoded by different mutant genes and are associated with different arrhythmic triggers, the most common being exercise such as swimming (LQT type 1), loud noises including alarms (LQT type 2), and sleeping (LQT type 3).96 The current mainstay of treatment for the most common types of LQT syndrome is beta blockade and avoidance of triggers.92 For patients who suffer VT events despite beta blockade and for patients with LQT types that tend not to respond as well to beta blockade, ICD placement is recommended.97
SQT syndrome is the most severe form of the major channelopathies and most commonly first presents as SCD occurring during rest, sleep, or exertion.92 It is diagnosed in the presence of a QTc <330 ms or with a QTc <360 ms with one of the following: documented causative gene mutation, family history of SQT syndrome, family history of sudden death at age ≤40, or prior VT/VF episode that is otherwise unexplained.3 It is related to autosomal dominant mutations in the K+ channel resulting in 3 syndromes, classified as SQTS1, SQTS2, and SQTS3.92 Considering the severity of SQT syndrome, the only recommended therapy is ICD placement, especially if the patient is a survivor of cardiac arrest or has documented spontaneous, sustained VT with or without syncope (Class I indication).3 ICD placement should also be considered in asymptomatic patients formally diagnosed with SQT syndrome who also have a family history of SQT syndrome.3
Wolff-Parkinson-White (WPW) syndrome is more common than the syndromes discussed above, affecting 2-4 persons per 1,000.98 WPW is not related to a known mutation but to the presence of an accessory atrioventricular conduction pathway located outside of the atrioventricular node. Because most such extranodal pathways lack the decremental conduction properties characteristic of the atrioventricular node, sudden death in WPW is most often related to the occurrence of atrial fibrillation, followed by rapid conduction to the ventricle over the accessory pathway, leading to VF.99 An asymptomatic patient with the classic findings of WPW on resting ECG (ie, a short PR interval and a delta wave, indicating ventricular preexcitation) has an annual SCA risk of 0.1%.100 Exercise testing and/or invasive programmed stimulation can be used to further risk stratify this population into those at low risk and those at high risk.101 Ablation of the accessory pathway in the asymptomatic patient is deemed reasonable in the current American College of Cardiology guidelines, but individualized decisions based on patient-provider discussion should guide therapy.102 When the accessory pathway is known to be high risk (ie, robustly conductive) or when it is associated with supraventricular tachycardia, ablation is indicated.
CONCLUSION
SCA is a common cause of death. While depressed LVEF is one of today's most useful indicators of risk, there is significant room for improvement in risk stratification, as LVEF is neither sensitive enough nor specific enough a predictor of SCA. When deciding whether to place an ICD, the clinician must weigh numerous factors including cardiac disease burden, noncardiac comorbidities, and patient preferences, as well as the possible adverse outcomes of the presence of an ICD, including inappropriate shocks and device-related infection. Although the surface ECG parameters described in this review may provide a considerable amount of useful information regarding arrhythmic substrate and SCA risk, any single test is unlikely to be powerful enough to adequately risk stratify patients regarding SCA. The identification of new tools for risk stratification of SCA is an active area of ongoing research. It seems possible that one or more of the candidate surface ECG parameters, including nonsustained ventricular tachycardia, high resting heart rate, heart rate turbulence, and Tpe, may become useful components of multifactorial risk stratification calculators in the future.
This article meets the Accreditation Council for Graduate Medical Education and the American Board of Medical Specialties Maintenance of Certification competencies for Patient Care, Medical Knowledge, and Practice-Based Learning and Improvement.
ACKNOWLEDGMENTS
The authors have no financial or proprietary interest in the subject matter of this article.
- © Academic Division of Ochsner Clinic Foundation
REFERENCES
In this issue


Jump to section
- Article
- Abstract
- INTRODUCTION
- VENTRICULAR FIBRILLATION AND VENTRICULAR TACHYCARDIA IN SUDDEN CARDIAC ARREST
- QT PROLONGATION
- QRS DURATION
- FRAGMENTED QRS COMPLEXES
- EARLY REPOLARIZATION
- HOLTER MONITORING
- HEART RATE VARIABILITY
- HEART RATE TURBULENCE
- SIGNAL-AVERAGED ELECTROCARDIOGRAM
- T WAVE ALTERNANS
- T-PEAK TO T-END
- INHERITED SUDDEN DEATH SYNDROMES
- CONCLUSION
- ACKNOWLEDGMENTS
- REFERENCES
- Figures & Data
- References
- Info & Metrics