Abstract
The practical application of Emergency Medicine throughout the country has historically been viewed by healthcare workers and patients as one of inefficiency and chaos. Believing that the practice of Emergency Medicine was, to the contrary, predictable, we at Ochsner felt that tremendous improvements in efficiency could be won if the vast amount of data generated in our experience of nearly 40,000 Emergency Department visits per year could be harvested. Such improvements would require the employment of computer technology and powerful database management systems. By applying these tools to profile the practice of Emergency Medicine in our institution, we were able to harvest important clinical and operational information that was ultimately used to improve department efficiency and productivity.
The ability to analyze data and manage processes within the Emergency Department allowed us to target resources much more efficiently, significantly reducing nonproductive work. The collected data were sorted and filtered by a host of variables creating the ability to profile subsets of our practice—most importantly, physician practice habits and performance. Furthermore, the development of “patient tracking” software allowed us to update, view, and trend data in real-time and tweak clinical and operational processes simultaneously. The data-driven, analytical approach to the management of the Emergency Department has yielded significant improvements in service to our patients and lower operational costs.
Healthcare is one of the last systems to embrace computer and information technology in its day-to-day operations—though the speed of that adaptation is accelerating. In 1992, when the Ochsner Department of Emergency Medicine set our goal of automating all clinical and management systems, there was virtually no one who could provide an integrated solution to every information need of our moderately sized Emergency Department (ED). The first challenge was whether we should build our own system or purchase an off the shelf software application that would not completely meet our needs. The eventual solution blended those options; non-integrated systems were purchased off the shelf, designed independently in-house, and developed through partnerships with the private sector. Waiting on an integrated solution to the department's information needs would have been a great error since, nearly 10 years later, a comprehensive solution has yet to become available in the marketplace.
We viewed automation as having three goals: (1) the production of an electronic medical record starting with automated physician's and nurse's notes, (2) visit data archival, analysis, and application in process management, and (3) an online data capture system that provided for real-time process analysis and improvement.
The Electronic Medical Record
The general opinion of those involved in Emergency Medicine informatics is that any successful effort at automation would implement electronic physician charting as the final stage of the project (1). Several issues, however, led us to develop and implement electronic charting as our first step. Specifically, the expense line for transcription was running nearly $300,000 per year (30,000 visits at an average $10 transcription cost per visit). Since the entire automation project was going to cost rather than save money in the short run, we felt it appropriate to address the most costly process in a nonautomated department: transcription. Secondly, it seemed logical and somewhat intuitive to us that the most important initial step should be the task of making legible the cryptic and often unreadable physician and nursing notes. It was our view that recording and documenting the care provided to the patient was a core service to our customers, that is, our colleagues at Ochsner who provide follow-up care to our patients. Finally, developing and implementing electronic charting challenged all personnel in the department to begin the work of becoming familiar with computers, software applications, and the day-to-day, if not minute-to-minute, problems inherent in interacting with these systems and keeping them up and running.
The department purchased EMstation® charting software from Vitalworks (Atlanta, GA; a division of Infocure, Inc) and customized the application's knowledge base. The resulting electronic charting system is a template-based system that was heavily reconfigured by one of the emergency staff to address the peculiarities of the community, the institution, and the group practice. This highly customized application has significantly improved physician efficiency and productivity. Benefits included a cost savings of nearly $300,000 per year, a legible note, and real-time access to the note by users outside the department through an upload from our network to the hospital mainframe system. These byproduct benefits alone (beyond the transcription savings in the first year) have justified the entire cost of the project to date.
The exchange of legible information is a key requirement in any charting or note capture system in a multispecialty practice. The electronic physicians' and nurses' note may look slightly primitive in comparison to the fluidity and color of transcribed notes, especially in the presentation of complex cases. However, due to the enormous expense, the cost benefit evaluation heavily favors electronic charting. The alternative, handwriting, is not—and can never be—an acceptable solution. No matter how flavorful, colorful, or rich the content, the frequency of illegibility limits the communication potential of the handwritten note. Additional benefits of the electronic note include automated coding, prescription writing, and discharge instructions.
In addition to the $300,000 per year saved for transcription, the direct cost savings of this phase of the project included the elimination of two clerk positions whose only purpose was to copy and carry the ED record to the department(s) where the patient would be seen in follow-up. The reality that these notes were now online and available to clinicians throughout the network eliminated the need to copy and transport hard copies, but most importantly, they were now available prior to the follow-up visit – a rare occurrence with transcription.
Electronic nursing notes remain in development at this time with implementation scheduled for this year. The physician note capture, completed in 1995, has required a great deal of support from the emergency staff. The input devices, the mouse and keyboard, were not nearly as intuitive as the telephone. However, once the benefits of computerizing the note became obvious, the 3- to 4-month learning curve and the occasional frustration of computer downtime became nonissues.
The Patient Visit Database
Electronic charting by physicians and nurses, though extremely valuable, did not capture all of the important aspects of the clinical encounter. We never believed that the electronic medical record would solve all of our data needs. Many important aspects of the patient encounter were still needed to complete a data profile of the department's core activities (e.g., demographic information such as patient zip codes, payor classes, and primary physicians). Important process events were also left uncollected outside of the computerized physician note, such as time data points for patient arrival, initial patient triage, initial physician interaction, tests ordered, procedures performed, consultants called, and final patient dispositions. To complete the database profile of the department (in addition to the information collected from data fields in electronic charting), an application was needed that could extract a large number of variables and process events from the patient's chart upon discharge. Since no such application was commercially available, we built our own.
Working with hospital information systems, an application was built using a PowerBuilder® (Sybase; Emeryville, CA) front end, Oracle® (Redwood Shores, CA) database, and Access® Report Writer (Microsoft; Redmond, WA). The problem of collecting the data was solved through both direct interfaces to the hospital information system and manual data entry post-discharge by a data clerk. The marriage of these two data pools created a very rich database. This aspect of the project began in 1996 and, again, was our internal solution to the lack of a comprehensive, integrated data management system for emergency departments. Electronic charting and post-discharge data entry complemented each other and clearly began to represent a solution to our need for information across the entire breadth of the patient visit.
The resulting depth of data provided the opportunity to profile the performance of the department in general and the emergency physicians individually. The versatility of the Oracle® database and Access® report writer allowed us to further sort the patient's encounter by zip code, age, payor class, diagnosis codes, disposition, physician, and time of day, creating an opportunity for an incredibly robust set of reports (Table 1). All of the reports are geared to measuring, analyzing, and monitoring our ability to meet core service objectives of both the department and physicians individually.
Access reports available from the Ochsner Emergency Department system.
Analyzing Physician Performance and Clinical Outcomes
Emergency departments, in our view, are a complex ballet of processes and events occurring with a great deal of individual physician variability reflected in a host of physician performance measurements. With the visit database built and with the ability to sort and filter the data, it was our goal to profile physician habits and performance in areas of efficiency, productivity, and cost effectiveness. The factors that influence all of these performance variables are specifically physician-driven decisions as to whether or not to order certain tests, whether to consult specialists, whether to admit or to discharge a particular patient, and to which hospital unit (of variable cost) to send the patient. We believed that if physicians could view and contrast their performance against other physicians, who appeared to be more or less efficient and productive, overall departmental performance and individual physician performance should improve as nonproductive work was identified.
Physician and overall departmental efficiency translate directly to space planning and operational cost. Each 15-minute decrease in a patient's length of stay equates to a reduced need for one ED bed when ED volumes are at 100 patients per day (2). The expense of one ED room, in terms of capital cost to build and equip, is in the range of $400,000 per bed (3). Also worth considering is the hospital operational cost of each ED bed, which is approximately $13,000 per year. The savings of reducing a patient's length of stay in the ED becomes clearly important from a capital and operational expense standpoint, not to mention the impact on patient satisfaction. Though we have seen an erosion of efficiency in the past year due to hospital bed capacity issues, from 1994 through 1999 our average length of stay was reduced from 2.9 hours to 1.9 hours for all patients (Figure 1). At 100 patients per day, and at a 75% bed occupancy time, a reduced need—or rather an increased capacity—of three beds was realized. In our experience, therefore, the derived one-time capital savings of $1.2 million and yearly reduction in operational expense of $39,000 per year give support to our efforts at improved operational efficiencies. Over the period in question, ED volume also increased 25% from 80 patients per day to 100 patients per day (Figure 2).

Length of stay reports for admissions, discharges, and total patient visits to the Ochsner Emergency Department, September 1992–September 2000.

Ochsner Emergency Department volumes, 1993–2000.
Inefficient departments are inherently bigger and more costly to operate than efficient departments. Once again, a significant portion of a department's efficiency and productivity derive directly from individual physician-specific efficiencies and productivities. One measure of physician efficiency is a report that reflects data for physician length of stay for patients discharged, patients admitted, and total patients, along with the percentage of patients with length of stay greater than 4 hours and 6 hours (Table 2). Also derived from the system is the ability to input physician hours worked and calculate productivity. Reports yield patients per hour, gross charges per hour, and average charge per patient (Table 3).
Year 2000 patient length of stay reported by physician.
Physician productivity report, January-June 2000.
The ability to place the patient in the lowest cost but most appropriate unit based upon the clinical diagnosis is also important in evaluating physician performance. To measure this ability, we developed a cost index for each hospital unit (such as critical care, observation, skilled nursing, and regular floor beds), which was further cost adjusted for the nursing skill mix and projected patient length of stay. The result was an internal bed/day number for each physician based on data collected from disposition decision making. The lower the bed/day number, the lower the “cost” of that specific physician's performance as shown in the bed/day report (Table 4).
Year 2000 capitated patient bed utilization report by physician.
Of course, the immediate expectation—if not an explicit goal—would be that physicians would alter behavior by increasing productivity, reducing patient length of stay, and choosing the most appropriate and most cost-effective patient disposition possible. The risk of this behavior, however, would be the possible erosion of the quality of care as evidenced by one measurement, ED revisit rates, resulting from abbreviated evaluations and premature and/or inappropriate ED discharges. Though the department continues to work on additional surrogate monitors of quality of care, the revisit rates for patients discharged from the ED remains a very important one. The 72-hour revisit report (Table 5) indicates the percentage of patients revisiting the department within 72 hours of a previous visit and whether the patient was admitted on the second visit. This report is broken out for capitated, noncapitated, and all patients. National benchmarks for this type of information are not available, but physician-to-physician comparison within the department provided the ability to internally benchmark an acceptable revisit rate.
Year 2000 72-hour revisit report by physician.
It must be said that all of this information is unblended, and each physician is able to compare his or her specific performance for all reports with every other physician in the department. This openness has allowed for the exchange of information in an effort to improve performance and standardize the approach to various clinical presentations in terms of patient management, testing, consultations, and dispositions.
The down side of physician profiling has been the addition of another layer of stress to an already stressful specialty practice. From a management perspective, however, the up side has been the ability to tie physician evaluations and, therefore, compensation, to performance, virtually eliminating complaints among physicians that compensation was neither fair nor predictable. This was accomplished by migrating the physician performance data over to a physician evaluation grid (Table 6) that yielded a composite performance score used to calculate compensation.
Year 2000 Ochsner Emergency Medicine physician performance evaluation form.
Automating Management Tools
Outside of the area of physician performance profiling, the blended data from electronic charting, interface-derived data, and post-discharge entry yielded an abundance of department performance information developed around our interest in measuring, analyzing, and monitoring core services. Over time, there are many influences on the core service measurements, some of which are not controllable by the Department of Emergency Medicine. The department is not immune to capacity, staffing, and budgetary restraints within the hospital, which invariably affect our practice and are reflected in the department performance charts (Figures 1, 3, 4).

Patient waiting times report, December 1997–December 2000.

Left without being seen, January 1996–November 2000.
One of our stated goals was to assume accountability for all aspects of patient care occurring within the ED and for all processes that occurred from the time the patient entered the ED until the time the patient left. For example, the unavailability of inpatient beds can affect our ability to move patients through the department. This is reflected in the patient's length of stay, though the responsibility for inpatient bed availability lies outside of the department. However, by taking full accountability for the entire patient's length of stay and all the attendant influences on patient length of stay, we are able to take this data back to hospital administration, or the responsible department, in an effort to gain buy-in and assistance in alleviating whatever bottlenecks are occurring. Reports include measurements of patient length of stay for admits, discharges, and all patients (Figure 1).
The “patient wait time report” (Figure 3) monitors the length of time from patient arrival to patient seen by triage nurse to patient seen by physician. Another important report indicates the percentage of patients who “left without being seen” (Figure 4) which we feel is a surrogate measurement of patient dissatisfaction regarding waiting time. It is clear from these reports that, with our extraordinary growth in patient volumes, we are approaching the limitations of services and supplies available to us, such as consultant time, ancillary test availability, and inpatient bed space. Once again, though the department is not truly responsible for all of these processes, in reality, it is important to assume accountability if there are going to be any incentives on our part to affect change outside of the department and to gather support for additional services and resources.
The benefits of this type of analysis are immediately obvious to any manager. There is a down side, though. As the department becomes increasingly more efficient, productive, and successful in providing “just in time” services, the moments of time usually available for personnel to recover during a workday become fewer and shorter. Stress and burnout increase. The goal then becomes one of optimizing, not necessarily maximizing, efficiency and productivity.
Optimizing Staffing Patterns
Surprising to many, but well known to those who practice Emergency Medicine, the pattern of patient visit times in the ED is extremely predictable. Our objective was to match physician staffing precisely, but relative to the pattern of patient visits so that the department is appropriately and adequately staffed for any given day of the week and for any given hour of the day. To accomplish this, we used the interface from registration to our statistics application to graphically display patient visit volume for each hour of each day of the week (Figure 5). From this hourly registration information, we were able to migrate the data and map physician staffing (Figure 6) to the pattern of patient visits. The registration data were then factored by what was determined to be optimal physician productivity. An optimal target workload of 2.1 new patients per hour was determined to provided sufficient time for direct patient care, resident supervision, electronic charting, administration, and (importantly) professional and social interaction with colleagues. Optimal productivity (new patients seen per hour) was based upon our experience and knowledge of the clinical mix of patients. The American College of Emergency Physicians recommends a range of 1.5–2.5 patients per hour (4). We could, therefore, provide appropriate staffing and minimize times of overstaffing and understaffing. This is a significant improvement from both a budget and a patient satisfaction viewpoint.

Average patient registration by hour, October 2000.
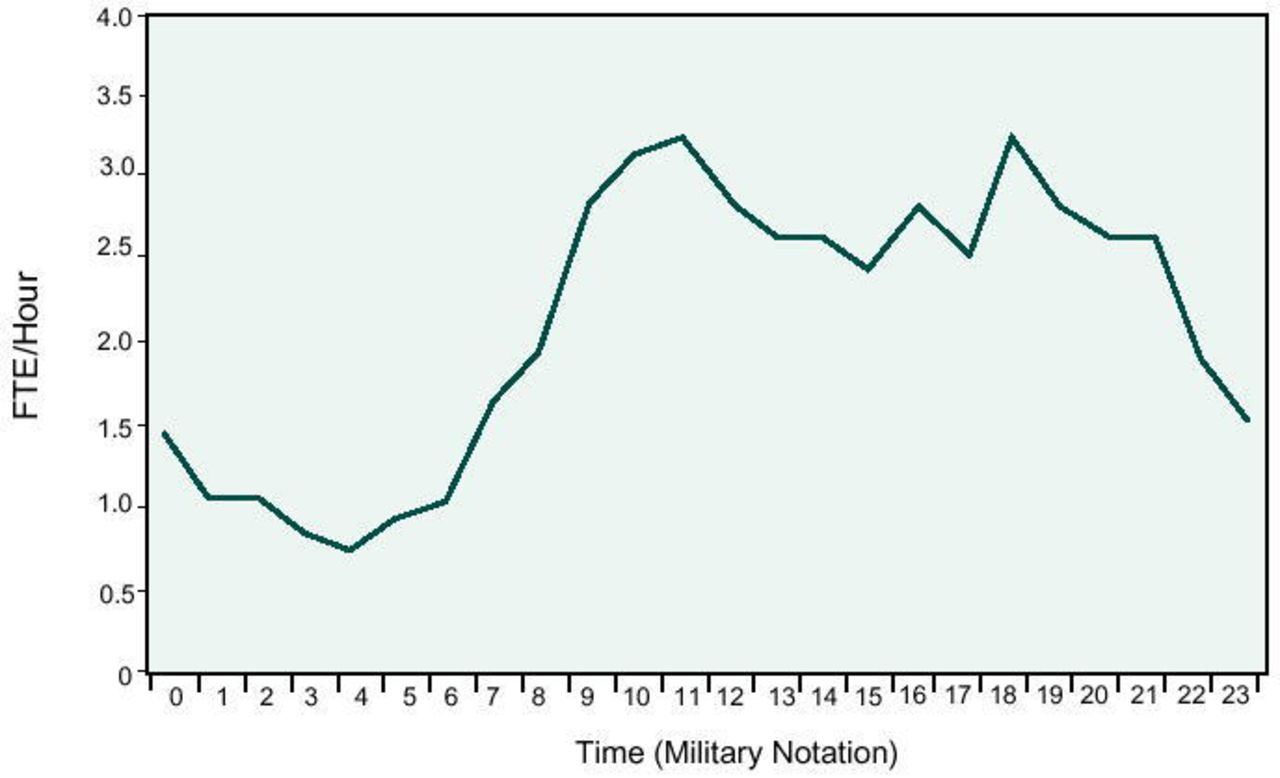
Physician staffing at 2.1 patients per hour, October 2000.
Real-Time Process Management
The last phase of automation was an attempt to bring online all of the active patient care processes that were occurring in the ED. This project had two major goals: 1) computerize and display online all of the important patient care processes so that, at any moment in time, any individual in the ED could view all the active patients and monitor all the clinical events in progress and the stage of completion of these processes; and 2) have the physical act of entering information or interacting with the online system automatically record and time-stamp the events and populate the data fields previously entered manually at discharge. This system will eventually eliminate two data clerks doing post-discharge data entry, generating a savings of $50,000 per year.
This project was also initiated through a partnership with Vitalworks. The system was designed in-house and programming outsourced to Micro Master Corporation (Dix Hills, NY). The result is essentially an electronic greaseboard, easily configured to allow the system administrator/manager to track any of 24 patient processes in real-time during the patient's stay. A view of one patient tracking screen (Figure 7) lists the following information: patient location, patient name, age, gender, acuity, length of stay, resident and staff seeing the patient, nurse, ancillary testing, consultants, and disposition and comments. Each patient care process is recorded and time-stamped whenever the user interacts with the system to update a particular process. For example, the system will track x-ray ordered, patient taken to x-ray, x-ray completed, and x-ray read. This is true for laboratory tests and other special procedures. Additionally, when residents, staff, and nurses sign on to a patient assuming clinical responsibility or execute orders and tests, the system time-stamps those events. The system can then generate overall length of stay for the patient, overall length of stay by physician, and the length of individual processes such as time to x-ray completion and time to lab results report, as shown in the patient progress report (Figure 8).

Example of patient tracking screen.

Example of patient progress report listing time-stamped events.

Dr. Guarisco is the Chairman of Ochsner Emergency Department.
Additionally important from a management perspective is the ability to place alarms on each patient process, such that as these process times are exceeded, an alarm, as noted by an icon color change, is triggered, indicating that a patient care process has exceeded an acceptable time standard. This allows the manager to intervene at critical times to eliminate bottlenecks. The entire process has come to be known generically as “patient tracking,” but, in reality, it is information management in real-time. The application, now 6 months postimplementation, is clearly providing for the project's first goal of real-time process management and is beginning to yield data byproducts of patient care events without the need for manual post-discharge entries: our second goal.
Using the system's report writer, management reports can be generated directly from the online activity. These reports are available for a manager or user to access information regarding efficiency and productivity information for any window of time.
The size of the ED presents the additional problem that patients may be in any of three locations within the department. The patient tracking and information management software allows users from anywhere in the department to view and update patient status at a remote location within the department, saving a tremendous amount of time for the physicians, nurses, and other users of the system.
This real-time patient process information is also available to department personnel in the waiting room and facilitates their efforts to keep patients' friends and family members informed in real-time. The next phase of our information management system will place a monitor in the waiting area directly for patients or patients' families to view. Each patient will have a unique “password” identifier, thus giving family members of the patient direct access to the status of clinical events and tests, closing the information gap for patients and family members of patients in the emergency department waiting room.
An exciting project now in development allows management in the ED to view the system via a modem pool providing a direct connection to the hospital network. This will allow the ED manager to view, monitor, and tweak active patient care processes from remote sites. We expect this to be a powerful management tool.
Conclusion
The automation of clinical and operating systems in the ED has been a success in terms of the improvements in the efficiency and productivity of the department. There is no doubt, however, that the tangible cost reduction of electronic charting in the range of $300,000 per year (>$1.0 million to date) has created a net positive budget impact and alone justifies the cost of the entire project. Automation has also yielded a one-time capital expense reduction ($1.2 million) and continuing operational savings ($39,000 per year) by reducing ED bed requirements. The consolidated project cost/savings analysis (Table 7) shows an approximate $2.2 million net savings to date with a continuing yearly cost reduction of approximately $289,000 (cost savings from the elimination of transcription plus other operational savings from bed reductions partially offset by the additional cost of two data clerks). The indirect cost savings and expense reduction from these systems are somewhat less clear. However, the impact from higher productivity, greater efficiency, and enhanced information management have rippled beyond the Department of Emergency Medicine to include other departments and systems such as Medical Records, Radiology, laboratories, and virtually every clinic-based department which sees our patients in follow-up.
Ochsner Emergency Department patient data tracking system project cost analysis.
In addition to the obvious hardware and software costs, there has been some cost to personnel in terms of the additional stress on top of an already stressful specialty practice. Additional stressors derive from the pressure to learn new performance tasks and understand complicated software systems. Anxiety is also created by the dependence on electronic systems that occasionally fail and by the awareness that performance is always being monitored. Finally, additional work is created as these systems optimize and at times inadvertently maximize productivity.
Development and implementation of new systems and applications are continuing with close monitoring of downstream effects on patient care and personnel. However, considering all issues, the ED automation project continues to be successful in its goal of improving productivity and both clinical and operational efficiencies.
Acknowledgments
Vitalworks, A Division of Infocure, Inc. (Atlanta, GA)
Micro Master Corporation (Dix Hills, NY)
Todd Petit, Project Consultant, Ochsner Information Systems
Cristina Guthrie, Project Manager, Ochsner Information Systems
Charles Sea, MD, Co-Director, Ochsner ED Informatics
- Ochsner Clinic and Alton Ochsner Medical Foundation